
One of the most enduring and best-documented behavioral biases in investing is called “The Home Country Bias.” Despite the availability of well-regarded and highly profitable corporations located throughout the world, investors tend to limit their investments to those companies domiciled in their own country. At one time, a survey of institutional investors in France found that 97% of their equity investments consisted of French companies despite the fact that France represented only 3% of the world’s total equity capitalization. Such a bias is found all over the world. British investors prefer British companies, Japanese investors prefer Japanese companies, and U.S. investors prefer companies domiciled in the United States. Despite the substantial risk-reducing benefits of international diversification, investors all over the world exhibit a home country bias.
In addition to the risk-reducing benefits of broad diversification, investing outside one’s home country is consistent with the basic rationale of index investing. In any national market, active portfolio management (involving the purchase of a subset of stocks believed to offer above-average returns) must be a zero-sum game. Since all the stocks in any market must be held by someone, the gains and losses from active management must balance out. If some investors are holding those stocks that produce above-average returns, it must follow that other investors must be holding the stocks that provide below-average returns. We can’t all be above average.
Despite the substantial risk-reducing benefits of international diversification, investors all over the world exhibit a “Home Country Bias.”
But, in fact, active investment management must be a negative-sum game. If active managers charge an expense ratio of, say, 1%, and if an index fund that buys and holds all the stocks in the market can be obtained at close to zero cost, then the typical active manager must underperform the index fund by the difference in expense ratios. And empirical data confirm that active managers as a group do underperform the market by the difference in the expenses they charge investors.
The argument can be extended to world markets. If some active managers are holding only the stocks in national stock markets that outperform the world average, it must follow that other investors are holding stocks in the various country markets that have underperformed. The global index investor who holds a portfolio that consists of all the stocks in the world (by holding a world index fund or all the components of the world markets) must therefore outperform the average active manager who holds only a subset of the world’s equity securities.
Such a global portfolio would need to include emerging-market (EM) equities as well as equities from developed markets. The question then becomes how large a role should EMs play in your portfolio.
Emerging Markets Are Too Large to Be Ignored
If we are to come to some reasonable judgment regarding the appropriate exposure of an investment portfolio to emerging markets, it is important to understand their size and importance to the world economy. The table below presents the total market capitalization of the various regions of the world in millions of dollars. Note that the United States represents only 36.2% of the world’s market capitalization. EMs represent 24.6%. Thus, if an investor wished to hold a world portfolio weighted by market capitalization, almost one quarter of that portfolio would consist of EM equities.
Figure 1, World Equity Market Capitalization, by region, March 2015*
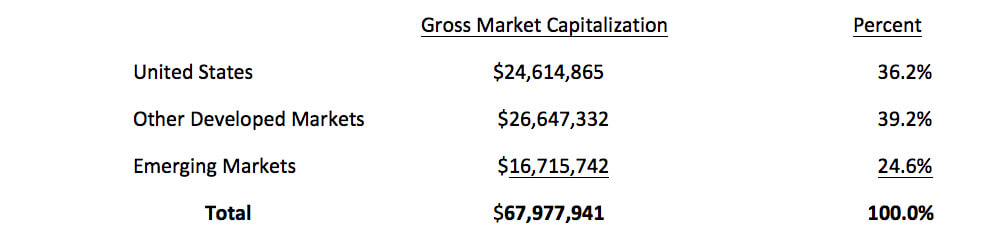
*Figures are not float adjusted and Korea is considered an emerging market consistent with MSCI indexes. Excluding so-called “control holdings” emerging markets represent 17% of the total (Control holdings do not trade in the market; an example of this would be a government that holds 50% of a company’s stock to maintain control of it, these shares will not trade freely and will not be available to investors).
Source: World Bank, World Development Indicators
Another metric that might be used to judge the appropriateness of an emerging markets equity allocation is to examine the share of world gross domestic product represented by these markets. Inter-country comparisons can be tricky requiring exchange rate and purchasing power parity adjustments. In one estimate, made by the International Monetary Fund, emerging markets have already exceeded the GDP of the developed market countries, as is shown in Figure 2 below.
Figure 2, Cross Paths
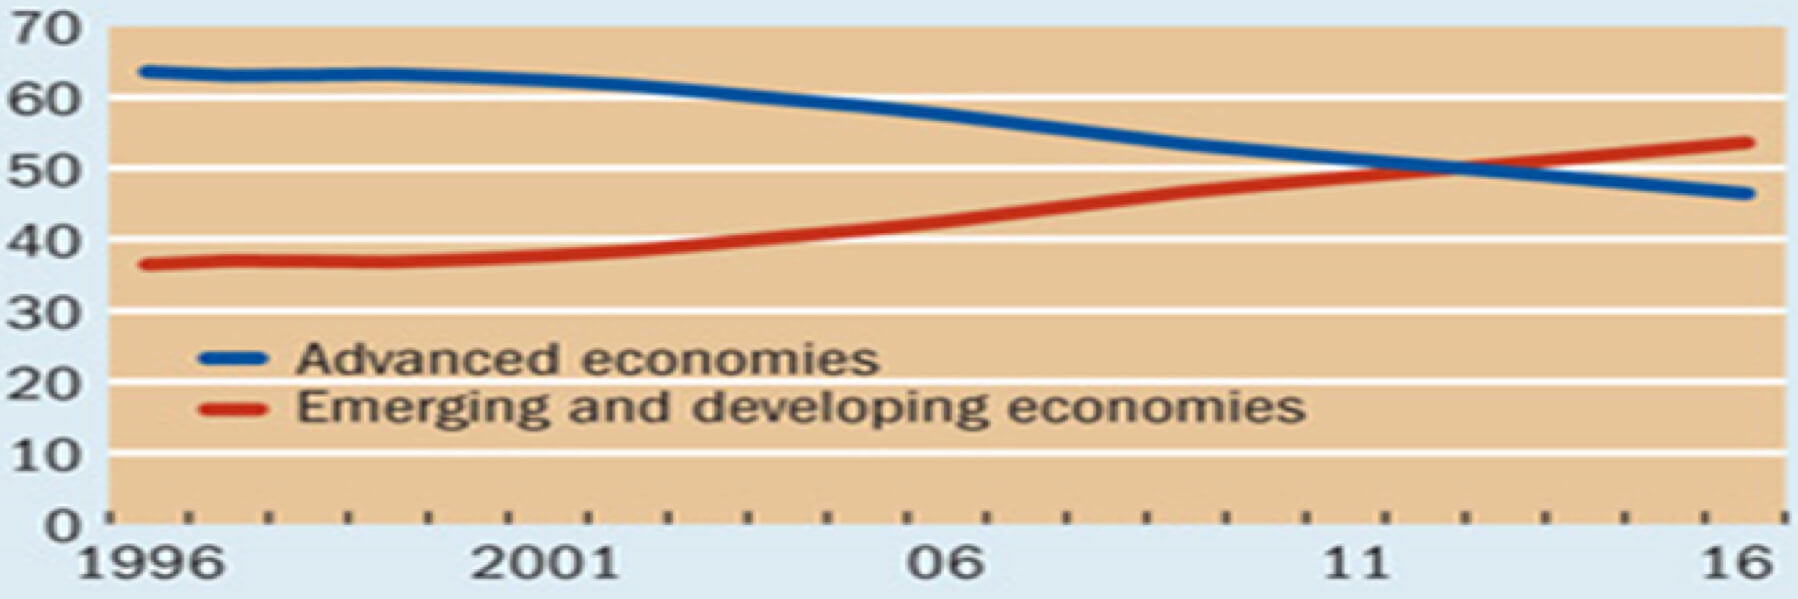
Emerging and developing economies’ share of world Gross Domestic Product (GDP) have exceeded that of advanced economies starting in 2013 (percent of world GDP, based on purchasing power parity).
Source: IMF, World Economic Outlook database.
According to the World Bank, by 2020 both China and India will have GDPs exceeding that of the United States.
Figure 3, Developed and Emerging Market GDPs, 1950-2050
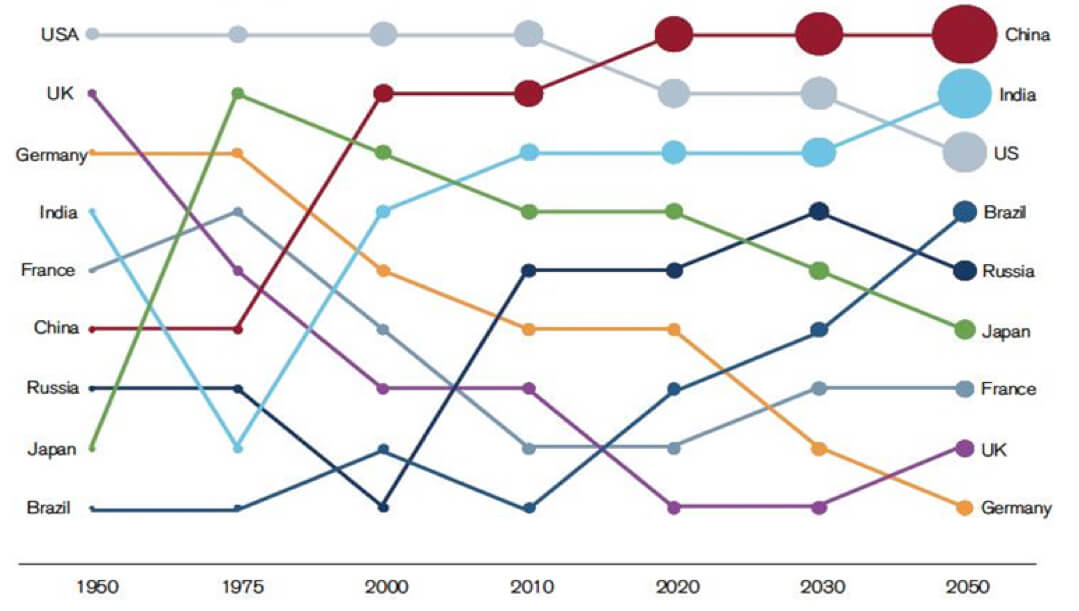
Source: Data from World Bank and The World in 2050, PriceWaterhouseCoopers 2008; updates from John Hawksworth and Gordon Cookson; author’s analysis
The World Bank reduced its growth forecasts for the world economy in its most recent January 2015 report summarized in Figure 4. But it noted increasingly divergent trends. The Bank remains pessimistic about the prospect for the developed world but more optimistic about the emerging economies. While growth has slowed in the developing world, the growth prospects for emerging-market economies remain substantially higher than those for the more mature economies. A major reason for the divergence is the substantial difference in the demography of the different regions of the world.
Figure 4, World Bank GDP Growth Forecasts, January 2015
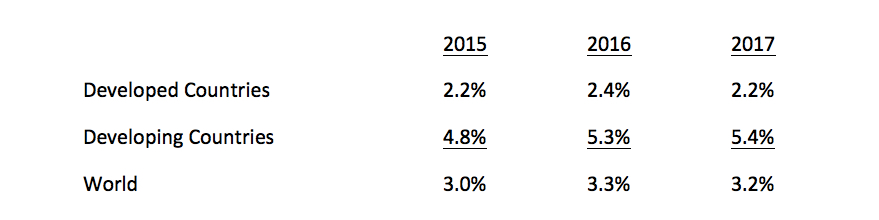
Source: Source: World Bank, Global Economic Prospects, January 2015
Populations are aging rapidly throughout the developed world. The ratio of the working-age to non-working age population will fall sharply over the next decades as is shown in Figure 5. By the end of the 21st century Japan will have a larger non-working population than its working-age population. On the other hand, populations in India and Brazil will be getting younger. Even in China, with its one-child policy, the demography will remain far more favorable than it is in more developed economies for at least the next decade. Countries with younger populations tend to grow faster.
Figure 5, Ratio of Working-Age to Non-Working Population, 2010 – 2025
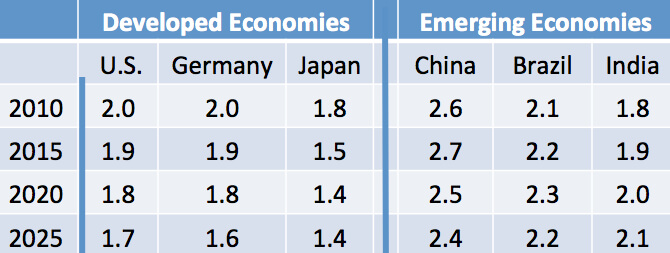
Source: World Bank, World Development Indicators
A Strong Home Country Bias Means Individual Investors Hold Too Little EM
While there is no single measure of the size of emerging markets to guide the appropriate weighting of these markets in globally diversified portfolios, the discussion above suggests a range of possible parameters. Emerging markets represent about 25% of the world’s equity market capitalization. Float-adjusted, these markets represent over 17% of the world total (float adjustment removes so called ‘control’ holdings that do not trade in the market. For example, if a government holds 50% of a company’s stock to maintain control of it, these shares will not trade freely and will not be available to investors).
With respect to economic activity, a weight of about one-half would appear appropriate, where the economic outputs of various countries are adjusted for purchasing power parity. Emerging markets, with their younger populations, are forecast to grow more rapidly in the future, suggesting that the relative size of these markets will increase as well. Moreover, more firms are likely to be privatized as economic reforms are implemented in emerging-market countries. Thus, the EM share of global-world capitalization should grow as well.
Despite the large size of emerging markets, investors in the United States allocate very small percentages of their equity portfolios to these markets. Individual investors hold less than 5% of their equity mutual funds in funds specializing in emerging markets. Institutional investors tend to hold more EM equities but the typical institutional allocation to EM is generally below 10%. The home country bias appears to be very strong. U.S. Investors tend to hold a far smaller share of EM equities than would be consistent with the size of these equity markets and with the share of world GDP represented by developing countries.
The CAPE Ratio Can Help
When considering the inclusion of an asset class in an investment portfolio, two other factors need to be considered. Risk and return are essential considerations in building optimal portfolios.
Investing in emerging-market equities does involve additional risk. Equity markets in developing countries are extremely volatile. Moreover, some emerging markets have relatively unstable governments. Foreign investing for U.S. nationals also involves the assumption of currency risk (or the need to engage in potentially expensive currency hedging). Risk mitigation would indicate a smaller share of one’s investment portfolio should be devoted to emerging markets than the previous discussion would suggest. Of course, portfolio considerations can cut the other way. As long as the correlations of the other asset classes with EM equities are moderate, adding volatile EM equities to a globally-diversified portfolio can, in some circumstances, actually decrease portfolio risk.
Return considerations would justify that a significant share of an investment portfolio should be devoted to emerging markets. The United States equity markets have rallied sharply since the depth of the financial crisis in 2008 and present valuation levels suggest that future return will be far more modest.
One of the best predictors of equity returns over the long run is the cyclically adjusted P/E ratio or CAPE ratio. It measures the current price of a broad stock-market index divided by the average earnings of the component companies over the past 10 years. The CAPE ratio is not a reliable predictor of returns one or two years in the future, but it does provide a useful (though not perfect) forecast of returns 10 years in the future. Figure 6 presents the U.S. data starting in 1926. When stocks had CAPEs of 10½ or less, the U.S. stock market produced 10-year returns of over 16%. But when CAPEs were over 25, returns tended to be far more modest, averaging under 4%.
Figure 6, Median 10-year Annual Compound Total Returns from Historic PE Deciles 1926 to Date
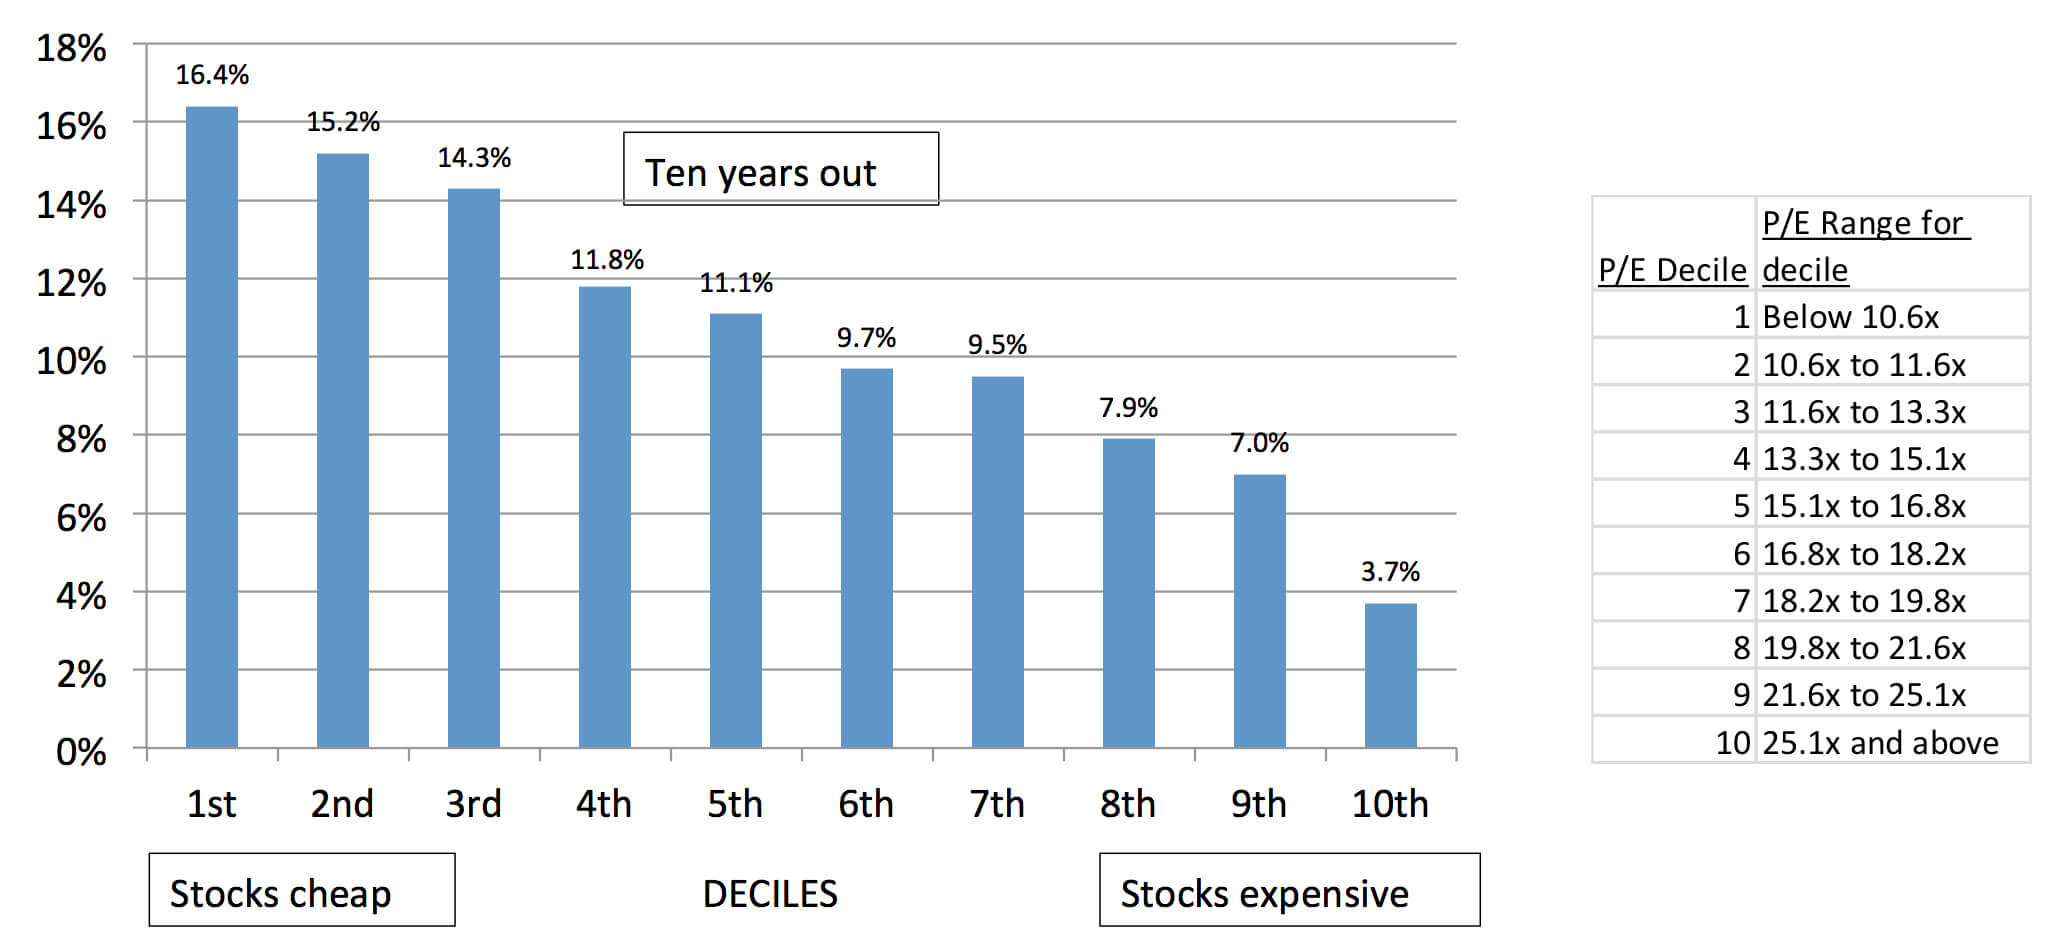
Source: The Leuthold Group
Unfortunately the CAPE ratio for the U.S. markets today is over 27 — an unusually high reading. Only in 1929, before the stock market crash and the Great Depression, and in early 2000, at the height of the Internet Bubble, was the CAPE at higher levels. Figure 7 presents a chart of the historical CAPE time series. To be sure, interest rates today are unusually low and that provides a justification for high asset prices. But the data also suggest that we should be projecting only modest future equity returns. (In the framework of the capital asset pricing model, the expected return for every level of risk is reduced when the “risk- free” rate is driven down to zero by the monetary authorities.)
Figure 7
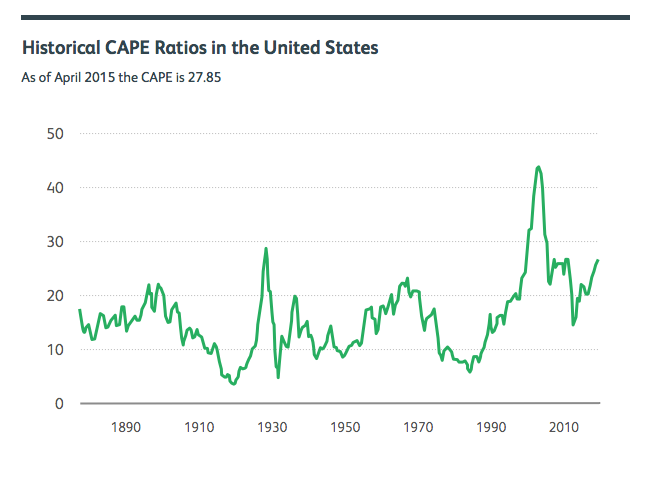
Source: Online Data Robert Shiller
The CAPE is a useful indicator for future stock-market returns not only in the United States, but also in foreign developed and emerging markets in general. The correlation of the CAPE with future stock-market returns is low for short investment horizons, but averages around 0.6 for investment horizons of 10 years in the United States. The CAPE has also been a useful indicator of future stock-market returns in EMs. Figure 8 presents some recent data.
Figure 8, CAPEs and Subsequent Returns in Emerging Markets (2005-2014)
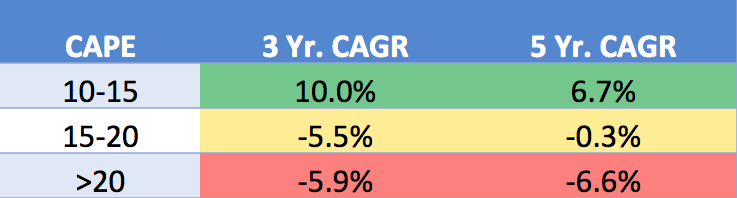
Source: WaveFront Capital and author’s calculations.
Unlike the situation in the United States, EMs have been relatively unpopular and valuations are extremely modest. Figure 9 shows that EM CAPEs are between 10 and 15. They have been far higher in the past. At today’s levels, they suggest relatively attractive returns over the longer run. The relative valuations in world financial markets suggest that a substantial allocation to EM equities can be justified, despite their greater risk.
Figure 9, Emerging Markets Cyclically Adjusted PE, 10/31/2005 – 3/31/2015
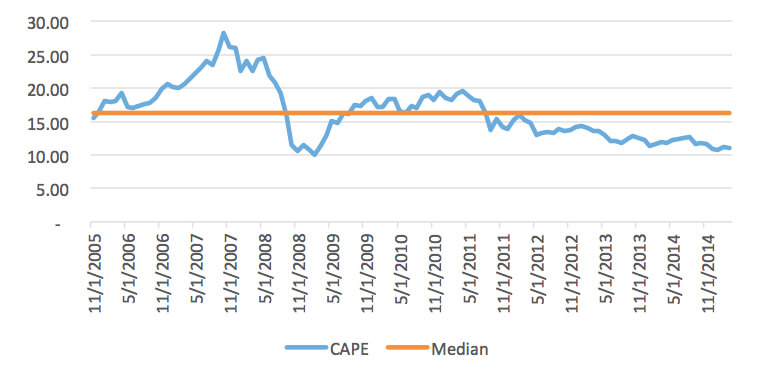
Source: WaveFront Capital and author’s calculations.
Indexing and Emerging Markets
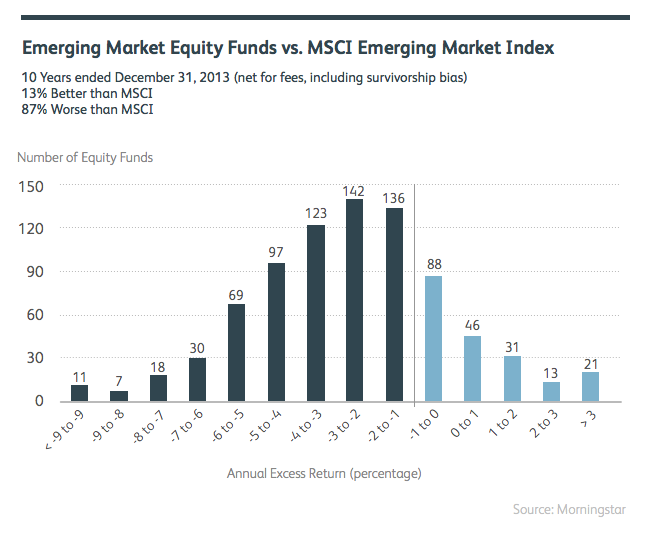
Investment professionals often argue that if one is to invest in relatively inefficient emerging-market equities, one should use active management rather than passive indexing. The evidence does not support such a claim. Figure 10 shows conclusively that active management performs especially poorly in EMs. Few managers outperform and those that do in one period are usually not the same as those that outperform in the next period. The very inefficiency of the trading markets in these countries makes active trading from one security to another particularly unrewarding. Bid-ask spreads tend to be high in EMs as are market-impact costs when blocks of securities are bought and sold. Moreover, a variety of trading costs such as “stamp taxes” makes trading extremely expensive. Indexing is the best way to gain exposure to EM equities.
Figure 10
A Summing Up
Emerging markets represent a substantial share of the total capitalization of world equity markets. While risky, these stock markets have relatively attractive valuations. At Wealthfront we have allocated between 5% and 28% of our portfolios to emerging market equities for investors who are able to tolerate some risk and who have long enough investment horizons to ride out the inevitable ups and downs of these markets. While our allocations tend to be higher than those recommended by many investment advisors, we believe that a home country bias has led to their underrepresentation in most globally diversified investment portfolios. And our allocations are far closer to the relative size of these markets in globally diversified capital markets. Certainly a market-capitalization weighted global portfolio would be a reasonable choice for an investor with average risk tolerance. Younger investors with long investment horizons and higher risk tolerances would find that portfolios farther out the return/risk spectrum would be appropriate.
Disclosure
Nothing in this article should be construed as a solicitation or offer, or recommendation, to buy or sell any security. The information provided here is for educational purposes only and is not intended as investment advice. While the data Wealthfront uses from third parties is believed to be reliable, Wealthfront does not guarantee the accuracy of the information. The analysis uses information from third-party sources, which Wealthfront believes to be, however Wealthfront does not guarantee the accuracy of the information. There is a potential for loss as well as gain. Actual investors on Wealthfront may experience different results from the results shown.
About the author(s)
Dr. Burton G. Malkiel, the Chemical Bank Chairman’s Professor of Economics, Emeritus, and Senior Economist at Princeton University, is Wealthfront's Chief Investment Officer. Dr. Malkiel is the author of the widely read investment book, A Random Walk Down Wall Street, which helped launch the low-cost investing revolution by encouraging institutional and individual investors to use index funds. Dr. Malkiel, also the author of The Elements of Investing, is one of the country’s leading investor advocates. View all posts by