Welcome to our Ask Wealthfront series, where we tackle your questions about personal finance and investing. Want to see your question answered here? Reach out to us on social media and we’ll try to address it in a future column.
What do I actually need to know about the yield curve?
You’ve probably seen the yield curve in the news—especially when the federal funds rate is changing or if some pundits are predicting a recession. But what is the yield curve and why does it matter?
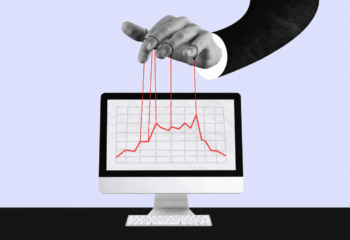
A yield curve is a plot showing the interest rates of bonds of the same credit quality (the y axis) across various maturities (the x axis). It’s important to know that there are different yield curves for different types of bonds. So in reality, there isn’t just one yield curve—there are many. In this post, we’ll talk primarily about the US Treasury yield curve, which is one of the most commonly referenced yield curves.The chart below shows the US Treasury yield curve as of September 25, 2024.

Why does the yield curve matter?
The yield curve gives you information about what markets expect interest rates will be at various points in the future for a particular type of bond. The yield curve can be normal, inverted, or flat. Each of these shapes tells you something about what investors expect from the economic environment in the coming months and years.
What does it mean when the yield curve is normal?
When the yield curve is “normal,” it tilts upward. The graph takes this shape when bonds with maturity dates in the near future have lower yields than bonds that are maturing farther in the future. This is “normal” because as an investor, you typically expect to earn a higher yield on longer-term bonds to compensate you for sacrificing some liquidity by investing for a longer period of time, and for taking on more interest rate risk (the risk that interest rates could rise and the value of your bond could fall as a result).

What does it mean when the yield curve is inverted?
When the yield curve is “inverted,” it slants downward, from left to right, instead. The graph takes this shape when bonds with maturity dates in the near future have higher yields than bonds that are maturing in the more distant future. This can happen when the Federal Reserve is raising or has recently raised interest rates. An inverted yield curve means that people expect interest rates will be lower in the future than they are today, and can sometimes reflect the fact that markets expect a recession, although it isn’t a perfectly reliable indicator.

It’s also possible for just part of the yield curve to be inverted. For example, in the yield curve at the start of this post, you might have noticed that the curve is inverted for maturities up to five years and normal for durations greater than five years.
What does it mean when the yield curve is flat?
Finally, when the yield curve is flat, short-term and long-term bonds have the same or similar yields. When the yield curve is flat, it can mean investors are feeling unsure about future growth of the economy. A flat yield curve (or flattening yield curve) can also happen when the yield curve is either in the process of inverting or un-inverting over time.

Should you use the yield curve to guide your investment decisions?
You might wonder how you can use information gleaned from the yield curve to earn the highest yield possible when you invest in bonds. The short answer is that you likely can’t. This behavior is called “yield chasing,” and it is a form of market timing. There are two main reasons that yield chasing probably won’t work:
- Market expectations about changes in interest rates are already priced into the yield curve. Let’s imagine you look at the yield curve and notice it is inverted, meaning the market expects interest rates to fall. Let’s further imagine you decide to buy bonds because you know bond prices will go up if interest rates fall, and your bonds could be worth more in the future. The problem with this approach is that these expectations are already priced in, and you’ll only come out ahead if rates decrease by more than the yield curve indicates. (And if rates decrease by less, your bonds could actually lose value.)
- Even if you strongly suspect that the yield curve is in the process of inverting or un-inverting, it’s very difficult to predict exactly when it will happen. It’s also tough to predict how it will happen, because sometimes one end of the yield curve moves more than the other as it changes shape. As a result, you won’t be able to reliably pick which bonds will offer the highest possible yield over time.
Put simply, you shouldn’t necessarily factor the yield curve into your plans before investing in bonds. It’s very tough to time the bond market by picking the exact right spot on the yield curve to invest, just like it’s very tough to pick a “winning” stock and generate outsized returns.
Instead of obsessing over the yield curve, we suggest thinking more broadly about bonds’ role in your portfolio. As we’ve written about before, risk and expected return are generally correlated—when you take more risk as an investor, you have a chance of earning higher returns (although this is definitely not a guarantee). Bonds tend to carry more risk than cash, which is why they usually offer a slightly higher expected return. On the flip side, bonds tend to be less risky than stocks, so their expected return is lower than what you’d get from equities. If you’re going to invest in bonds, we think it makes sense to do it when you decide they fit your risk tolerance—not because you’ve been studying the yield curve and want to try to time the bond market. And when you’re picking a bond duration, a good rule of thumb is to invest in bonds you feel reasonably confident you’ll be able to hold until maturity.
It can be a big hassle to manage a bond ladder manually (think spreadsheets and calendar reminders), but Wealthfront has automated the strategy completely. Our Automated Bond Ladder is built entirely from low-risk US Treasuries so you can earn a steady yield with no state income taxes. An Automated Bond Ladder could be right for you if you want to grow your extra cash, save for an important future expense like a home down payment, or help protect and grow a windfall.
Key takeaways
To recap, here’s what you should keep in mind about the yield curve:
- The US Treasury yield curve shows how much interest US Treasuries pay at different maturities.
- If the yield curve is normal, it bends upward and longer-term bonds have higher yields.
- If the yield curve is inverted, it bends downwards and shorter-term bonds have higher yields.
- If the yield curve is flat, that can mean investors aren’t sure what the future holds.
- The yield curve can indicate what markets expect interest rates to be in the future.
- You shouldn’t use the yield curve to try to time the market.
- If you want to diversify your bond investments along the yield curve, you can consider a bond ladder.
We hope this information helps!
Disclosure
Investing in U.S. Treasuries involves risks, including but not limited to interest rate risk, credit risk, and market risk. While U.S. Treasuries are considered to be among the safest investments, they are not entirely risk-free, and there is a potential for loss of principal. Returns on U.S. Treasuries can also be affected by changes in the credit rating of the U.S. government, although such occurrences are rare. Investors should consider their tolerance for these risks and their overall investment objectives before investing in U.S. Treasuries. Past performance does not guarantee future results.
The yield earned from U.S. Treasuries is exempt from state and local income taxes. However, interest income from Treasuries is subject to federal income tax. Tax treatment may vary depending on your individual circumstances. To understand implications for your specific financial situation, consult with a tax professional.
The information contained in this communication is provided for general informational purposes only, and should not be construed as investment or tax advice. Nothing in this communication should be construed as a solicitation, offer or recommendation to buy or sell any security. Any links provided to other server sites are offered as a matter of convenience and are not intended to imply that Wealthfront Advisers, Wealthfront Brokerage or any affiliate endorses, sponsors, promotes and/or is affiliated with the owners of or participants in those sites, or endorses any information contained on those sites, unless expressly stated otherwise.
All investing involves risk, including the possible loss of money you invest. Please see our Full Disclosure for important details.
Investment management and advisory services are provided by Wealthfront Advisers LLC (“Wealthfront Advisers”), an SEC-registered investment adviser, and brokerage related products, including the Cash Account, are provided by Wealthfront Brokerage LLC, a Member of FINRA/SIPC.
Wealthfront, Wealthfront Advisers and Wealthfront Brokerage are wholly owned subsidiaries of Wealthfront Corporation.
Copyright 2024 Wealthfront Corporation. All rights reserved.
About the author(s)
Fang Rui is a Chartered Financial Analyst (CFA) and an investment researcher at Wealthfront. Prior to Wealthfront, Fang spent nearly a decade at BlackRock where she worked in ETF and index research as well as risk management. She earned a Master of Science in Industrial Engineering and Operations Research from University of California, Berkeley and earned a Bachelor of Science in Engineering with a major in Operations Research and Financial Engineering from Princeton University. View all posts by Fang Rui, CFA