
Election years bring uncertainty, and this year’s presidential election is no exception. However, you might be surprised to learn that history shows they usually don’t have much impact on your portfolio. In this post, we’ll dig into the data.
What history tells us about investing during election years
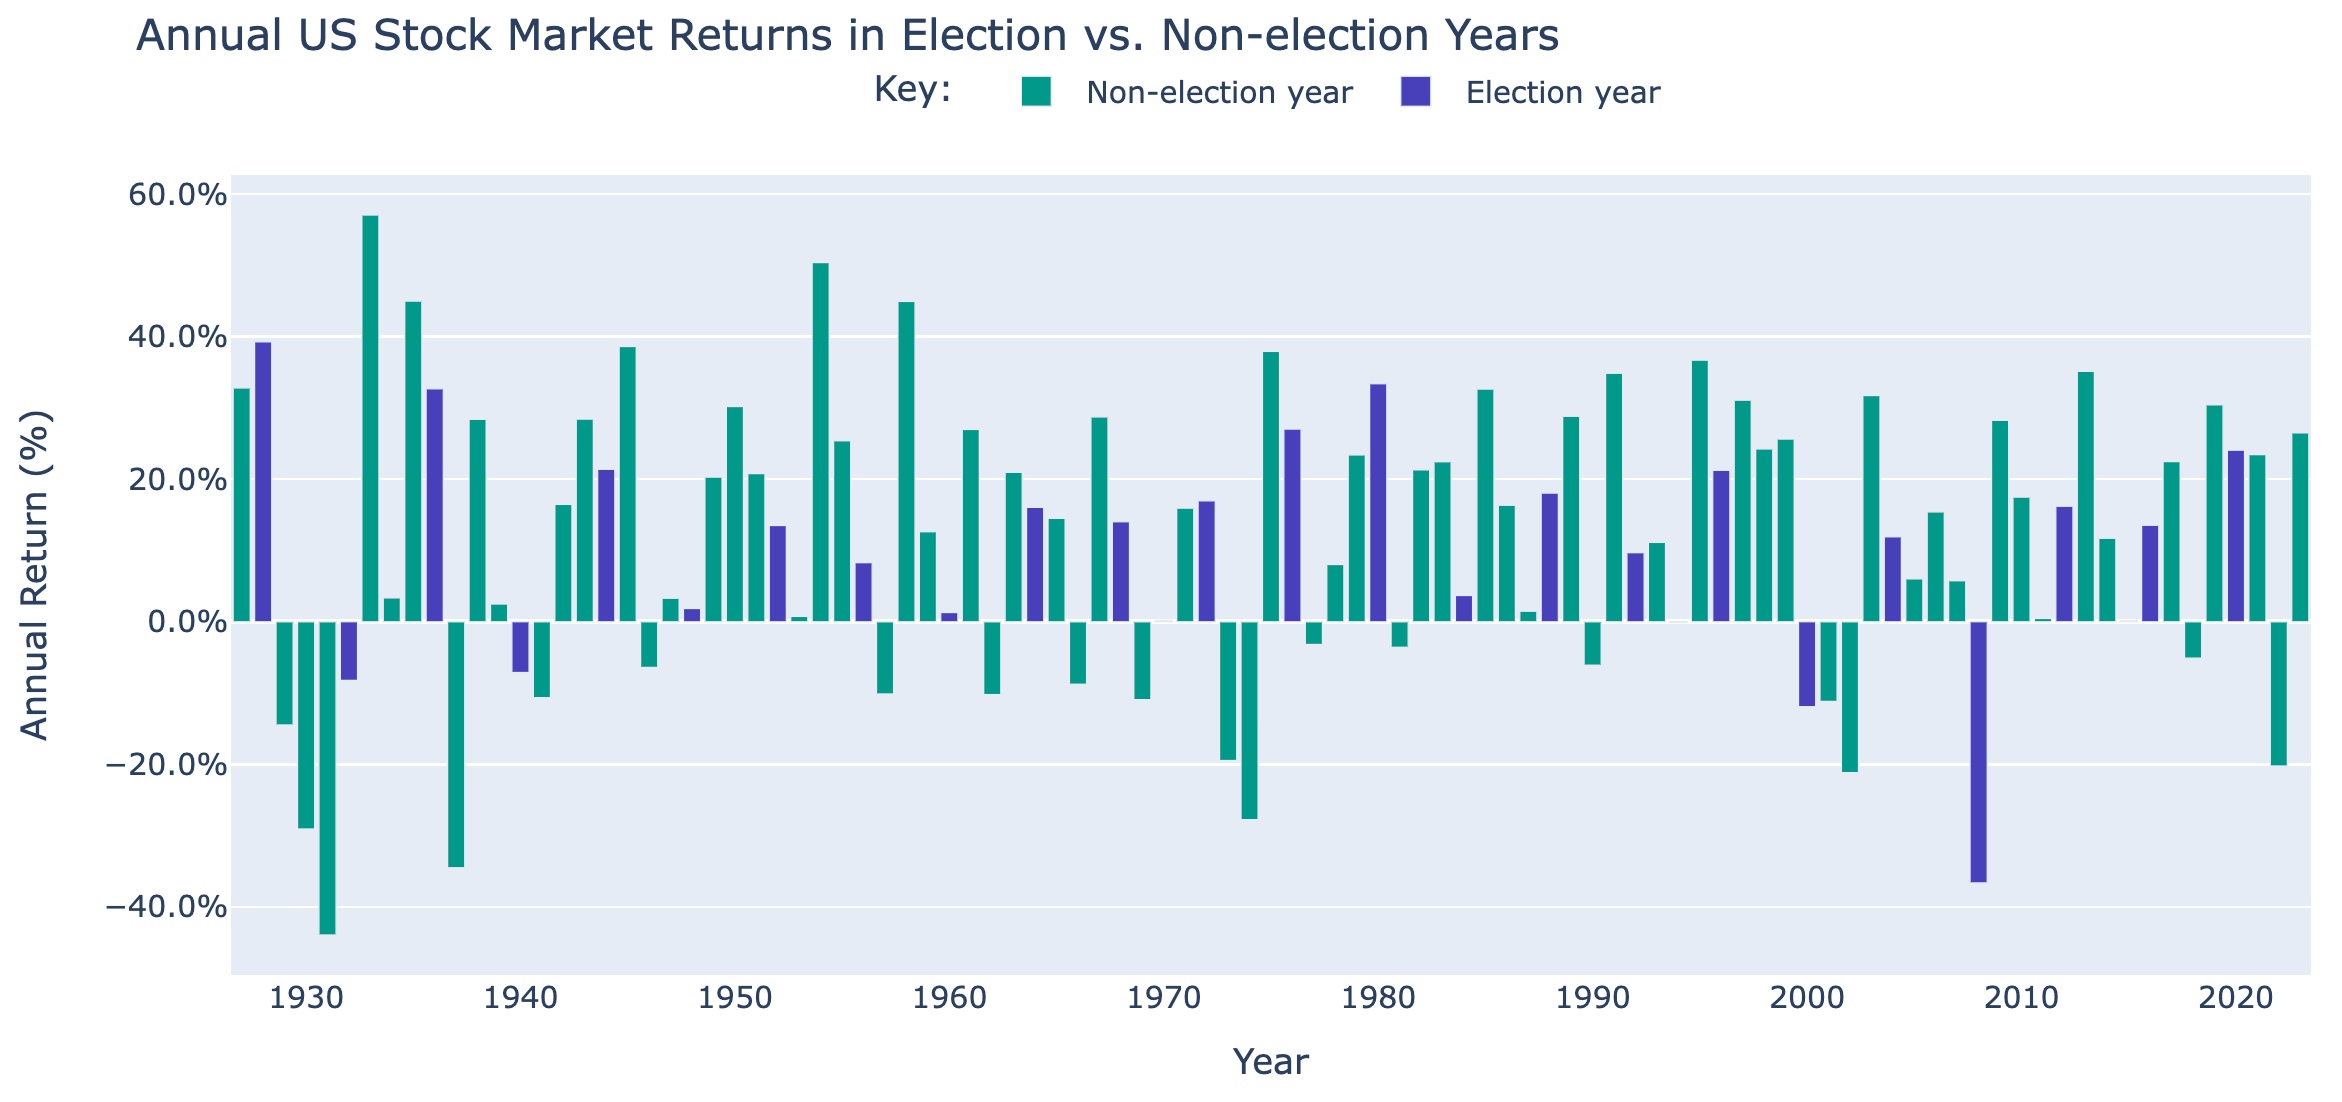
To understand the impact of presidential election years on investments, we looked at US stock market data all the way back to 1927, using Kenneth French’s data library. First, we analyzed mean annual returns for the US stock market for all years 1927-2023 compared to election years during that period of time.
We found that the mean annual total return for non-election years was 12.1% and the mean annual total return for election years was 11.7%. The chart below shows these returns. However, we also performed a t-test (a way of discerning whether or not results are statistically significant) and found that the difference between election year and non-election year returns was not statistically significant. In other words, US stock market total returns are pretty much the same on average whether or not it’s an election year.
Next, we compared average annual volatility in the US stock market in all years from 1927-2023 to see if election years are meaningfully more volatile than non-election years. We found that mean volatility in non-election years was 15% over that time period, and mean volatility in election years was 15.3%. However, once again, our t-test confirmed these differences were not statistically significant, meaning the US stock market, historically, is just about as volatile on average in an election year as it is in a non-election year.
Finally, we compared the average maximum drawdown (or largest decline from a recent peak) in the US stock market in all years from 1927-2023. We found that the average maximum drawdown was slightly greater in non-election years at -16.0% than in election years at -14.6%. Again, however, these differences were not statistically significant.
It’s worth noting that our analysis picked up some small differences between election years where Republican candidates won and Democratic candidates won. The US stock market had slightly higher mean returns, lower mean volatility, and smaller maximum drawdowns during years when a Republican won the presidential election. Here again, our hypothesis testing did not find evidence that any of these differences were statistically significant. Especially given the small number of total data points, the historical differences observed are small enough to be attributed to random chance.
Even if the market does decline or become more volatile in the short term (which is always possible), it’s important to keep an eye on the long term. Risk of loss generally goes down as your investing time horizon gets longer. If you plan to be in the market for the long run, fluctuations in your account balance today could end up being blips on the radar in the future.
Should you adjust your investment strategy in an election year?
Put simply, we don’t think so. As tempting as it may be, timing the market usually doesn’t work. Any information you have that you think might impact investment performance is presumably already broadly available. This means it’s already priced in, and you’re unlikely to come out ahead.
Instead, we suggest focusing on what you can control:
- Managing your risk: Invest in a portfolio that is appropriate for your risk tolerance, and rebalance it over time to ensure you don’t drift too far from your target allocation. Wealthfront automates this process so you don’t have to think about it.
- Keeping your costs low: Choose low-cost index funds whenever possible, and invest with a service that charges a low management fee (Wealthfront’s annual fee is just 0.25%).
- Minimizing your taxes: Harvest losses and use them to help lower your tax bill. The process of tax-loss harvesting can be time consuming if done manually, but Wealthfront does this automatically and at no extra cost.
Major events like elections can rattle investors. And while it’s true that there are some small differences in the annual returns, volatility, and maximum drawdowns observed in years when the United States elected a new president, it’s worth remembering that the number of data points is very small and the differences were not statistically significant. If you look at the big picture, these small differences in performance are ultimately not worth paying much attention to.
Disclosure
The information contained in this communication is provided for general informational purposes only, and should not be construed as investment or tax advice. Nothing in this communication should be construed as tax advice, a solicitation or offer, or recommendation, to buy or sell any security. Any links provided to other server sites are offered as a matter of convenience and are not intended to imply that Wealthfront or its affiliates endorses, sponsors, promotes and/or is affiliated with the owners of or participants in those sites, or endorses any information contained on those sites, unless expressly stated otherwise.
All investing involves risk, including the possible loss of money you invest, and past performance does not guarantee future performance. Please see our Full Disclosure for important details. Investment advisory services provided by Wealthfront Advisers LLC (“Wealthfront Advisers”), an SEC-registered investment adviser, and brokerage products and services provided by Wealthfront Brokerage LLC (“Wealthfront Brokerage”), member FINRA/SIPC.
Mean annual total return is calculated using time-weighted returns, net of all fees and expenses. Mean annual total return is calculated over specified periods and may not represent an investor’s actual performance. Actual performance may vary due to timing, taxes, withdrawals, and other individual factors. The returns shown represent historical performance and may not reflect future market conditions.
Average annual volatility reflects the historical fluctuation in the investment’s value over a specific period, expressed as a standard deviation of returns. It is provided for informational purposes only and does not predict future performance or the likelihood of achieving specific returns. Volatility is one measure of risk but may not capture all factors that could impact actual investment outcomes.
The information presented analyzes the impact of presidential elections on US stock market performance using historical data from 1927 to 2023, sourced from Kenneth French’s data library. Our findings indicate that the mean annual total return for non-election years was 12.1%, while the mean return for election years was 11.7%. Although we performed statistical analysis, including t-tests, to assess significance, the differences observed were not statistically significant, suggesting that U.S. stock market returns are comparable during both election and non-election years.
Examination of average annual volatility revealed mean volatility of 15% for non-election years and 15.3% for election years, with these differences also lacking statistical significance. In analyzing average maximum drawdowns, we found slightly greater drawdowns in non-election years at -16.0%, compared to -14.6% during election years, which were not statistically significant.
The potential for short-term impacts from political events, such as presidential elections, should be considered in the context of long-term investment strategies. Historical performance does not guarantee future results, and we encourage investors to focus on factors within their control, such as risk management, cost minimization, and tax efficiency. Investors should conduct their own research and consult with a qualified financial and/or tax adviser to assess their individual circumstances and determine the suitability of any investment or strategy and tax consequences.
Wealthfront Advisers and Wealthfront Brokerage are wholly owned subsidiaries of Wealthfront Corporation.
© 2024 Wealthfront Corporation. All rights reserved.
About the author(s)
Alex Michalka, Ph.D, has led Wealthfront’s investment research team since 2019. Prior to Wealthfront, Alex held quantitative research positions at AQR Capital Management and The Climate Corporation. Alex holds a B.A. in Applied Mathematics from the University of California, Berkeley, and a Ph.D. in Operations Research from Columbia University. View all posts by Alex Michalka, Ph.D
Greg Bodik is a data scientist at Wealthfront. He earned his BA in Computer Science and Statistics at Cornell University. View all posts by Greg Bodik