Recently, many investors have been wondering if stock prices are too high. Price-earnings multiples, as measured by the Shiller PE ratio, have reached their highest point since the dot-com bubble. Valuation metrics are unusually stretched. Large tech companies are making huge “circular” investments with the potential to backfire if AI doesn’t deliver on the hype. These sky-high valuations and complicated webs of investment have led many to wonder whether there is a bubble occurring in AI. And some market commentators have suggested this potential bubble could be as significant as the dot-com bubble at the turn of the century. But that doesn’t necessarily mean we’re in an AI bubble that is destined to pop, or that you should change your approach to investing in response.
Bubbles are notoriously difficult to predict, and it’s impossible to know for sure whether we are currently in one or not. But it is possible to look at a few recent examples to help contextualize what we’re seeing now. In this post, we’ll share our thoughts on bubbles and how to navigate them.
What is a bubble?
First of all, what is a bubble? Unfortunately, there isn’t a clear test you can apply to determine whether or not we’re in one. But roughly speaking, a bubble is when asset prices become detached from reality, reflecting growth expectations which would be incredibly difficult (if not impossible) to achieve. While bubbles can occur with any tradable asset, they are frequently associated with new technology. Bubbles can be very hard to identify ahead of time, because even if prices seem too high, who’s to say that the growth can’t materialize? That’s why a lot of the time, bubbles can only be identified after the fact.
A closer look at two recent bubbles
There are two incidents in relatively recent history where, in hindsight, we can fairly say there were bubbles. The first was the dot-com boom in the late 1990s and early 2000s. The start of this bubble coincided with low interest rates and plentiful capital, as well as the beginning of mass adoption of the internet. Companies could achieve massive valuations simply by incorporating “.com” into the company name. Perhaps the most well-known example was Pets.com. The company was deeply unprofitable, spending multiples of its revenue on advertising, and losing money on the items it sold. Nevertheless, Pets.com went public in February 2000, with a market cap of $290M as of its first market close on February 11. This was a value it would never reach again. Within nine months, the company ceased operations and began liquidating its assets.
This trend played out more broadly, too (although in a slightly less dramatic fashion). On the day of the Pets.com IPO, the Nasdaq Composite index (Nasdaq was the exchange of choice for many dot-com companies) closed at a level of 4395.45, a 178% increase from the beginning of January 1998, just over two years earlier. But after peaking a month later, it then bottomed out in October of 2002 at a level of 1114.11—78% below that peak.
It bears repeating that bubbles can only be identified for certain after the fact. Many say that the dot-com bubble was identified by the then-chairman of the Federal Reserve, Alan Greenspan, in a speech in 1996 when he coined the term “irrational exuberance.” While he was ultimately correct, it took years for his prediction to materialize—market prices continued to expand until March 2000. Consider that long-term index investors who bought the day after Greenspan’s speech still made generous returns over the long run. The 10-year total return of the US stock market starting from the day of the speech on December 5, 1996 was over 8.5% per year, even despite the bear market that began in 2000 and continued through 2002. To get those long-term returns, you had to stay in the market through the ups and downs.
The latest bubble to pop was the housing bubble of the mid-2000s. Low interest rates were once again a driver, coupled with lax lending standards and questionable financial engineering, where pools of low-quality loans were packaged into securities that were deemed “safe” by ratings agencies. Underlying the mania was a belief that home prices could never broadly decrease. From July 2001 to July 2006, the Case-Shiller Home Price Index increased by just under 62%, or about 12% annually (much higher than the roughly 4% annual growth observed in the years between January 1987, when the index data started, and July 2001). After this sharp growth, it then began a decline that many had believed to be impossible. The index declined for over five years, before finally finding a bottom in February 2012, at a level more than 27% below its peak. As house prices declined, borrowers who took out loans with low but temporary “teaser” rates couldn’t refinance at similarly low rates, and also couldn’t afford their new higher payments. Mortgage defaults increased, and the value of “safe” mortgage-backed securities plummeted. Investors with exposure to mortgage markets began to suffer enormous losses.
If the dot-com boom had Pets.com as its poster child, the housing bubble had two: Bear Stearns and Lehman Brothers. Both companies were heavily exposed to the mortgage market, had stock prices that peaked in early 2007, and were defunct by the end of 2008. Bear Stearns’ demise was somewhat more orderly, as it was sold to JPMorgan Chase in a distressed sale in early 2008. Lehman Brothers, however, declared bankruptcy on September 15, 2008. The S&P 500®, already in a bear market off of its late 2007 highs, fell by over 4.7% on the same day. It would continue to fall another 43%, bottoming out on March 9, 2009 at a level more than 56% below its previous peak. It took until March 28, 2013 (or about 5.5 years) for the index to reach its previous highs again.
What we can learn from previous bubbles
Although these two bubbles played out differently, there were four important similarities:
1. The overall US stock market suffered, even though the bubbles originated in narrower areas (tech companies and home prices/finance respectively).
2. The impact was not uniform across sectors—some did far worse than others. Not surprisingly, the “originating” sectors of tech and finance did the worst.
3. In both cases, the US stock market eventually recovered—even if that recovery took some time.
4. Long-term equity investors who stayed the course continued to earn generous returns.
To illustrate the first two points, consider the chart below, which shows the peak-to-trough returns for various sectors, as well as for the total US market. Keep in mind that this chart only illustrates the maximum drawdowns for one asset class, US stocks. Not all asset classes experienced the same steep declines in the aftermath of these bubbles. For example, AA-rated corporate bonds declined just 3.7% from peak to trough after the dot-com bubble, and just 12.3% after the housing bubble.
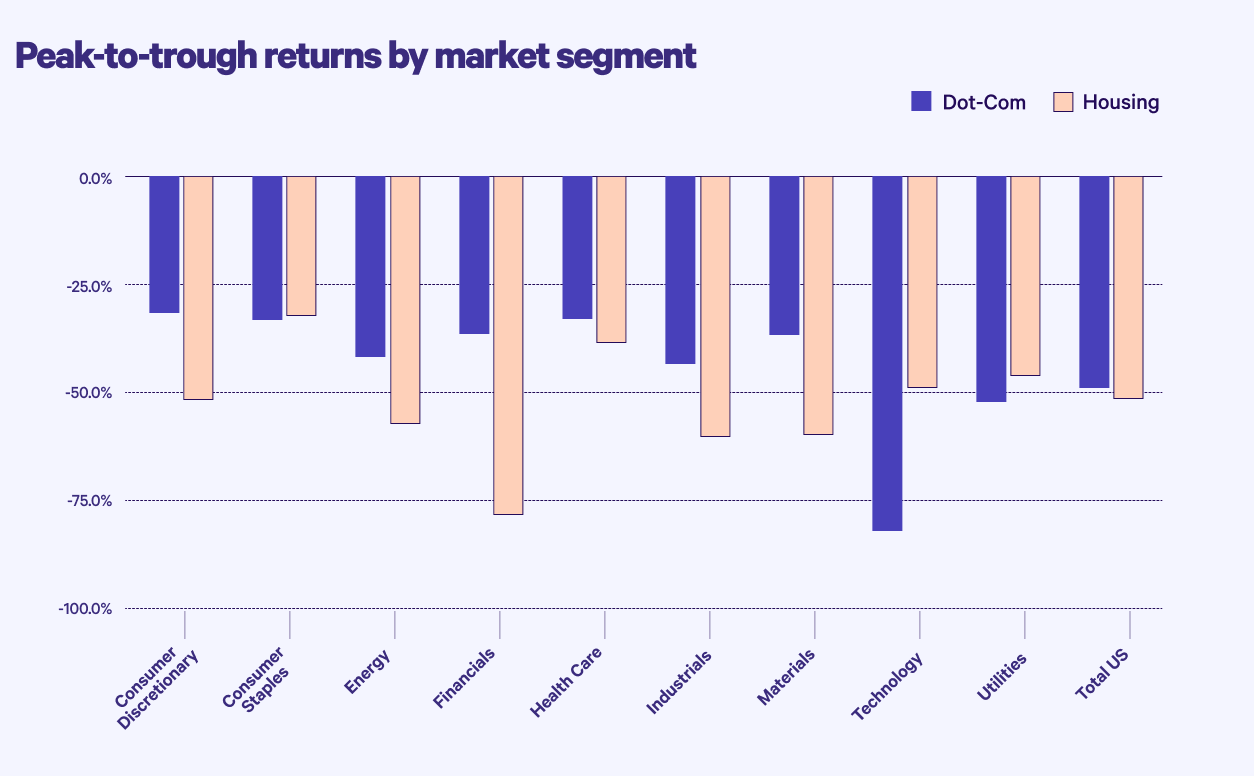
Source: CRSP
To illustrate the third and fourth points, consider the below graph which shows the value of $1 invested in the US stock market from 1926 to 2025. As you can see, the overall trajectory of the US stock market over that long period of time has been upward—while both the dot-com bubble and the housing bubble are visible if you zoom in, they did not alter the general trend.
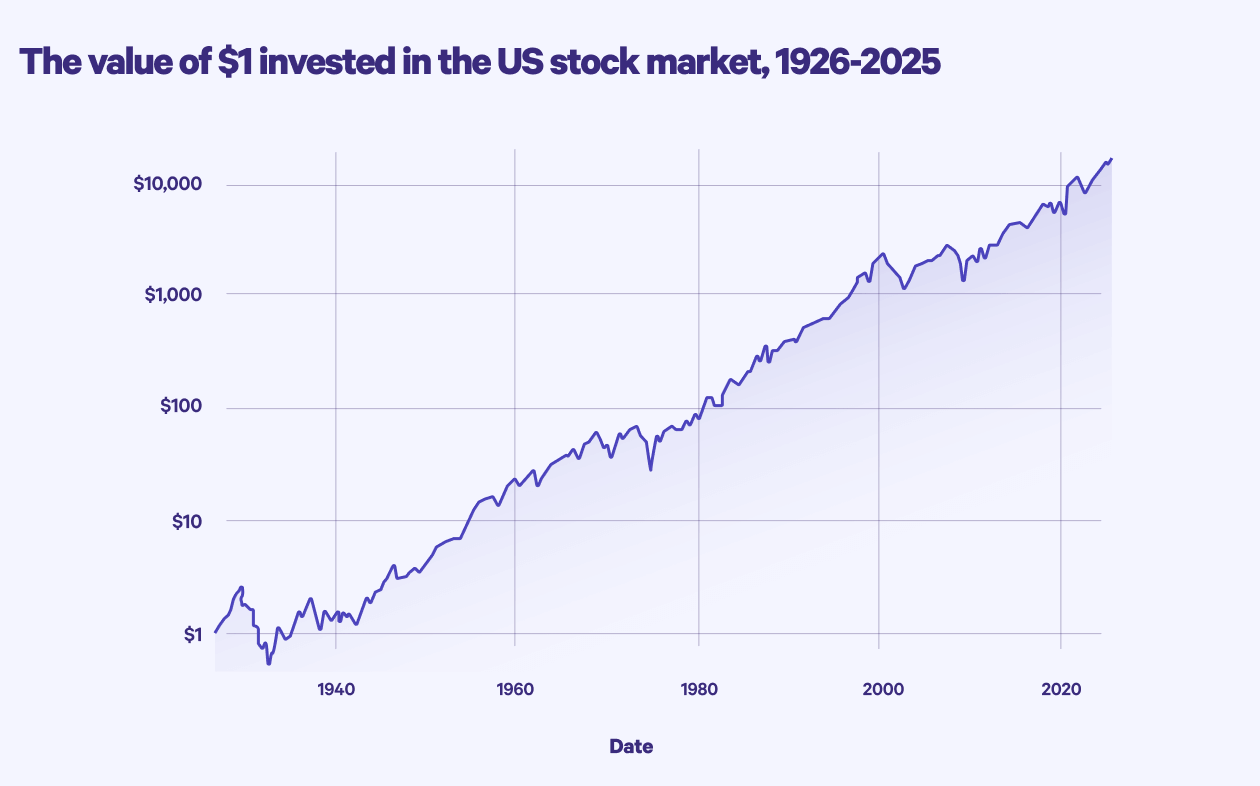
Source: Kenneth R. French Data Library
How to navigate bubbles
Risk is part of investing. You need to put money at risk and endure occasional downturns and bear markets to earn more than the risk-free rate (usually represented by one-month Treasury bills or overnight deposit rates), and your willingness to do this is what allows you to build wealth over time instead of just losing buying power to inflation. Bubbles developing and popping are just one of the risks of investing.
While we don’t think it’s possible to accurately predict or avoid bubbles entirely—that would be a form of market timing, which is incredibly hard to do—it’s possible to mitigate your exposure. The easiest way to do so is through diversification. If you’re worried about overexposure to AI in your portfolio, your best defense is to ensure your investments include a range of assets and asset classes, including international investments (because much of the market weighting for AI is concentrated in the US).
If you had been fully invested in Pets.com or Lehman Brothers, you would have fared extremely poorly in 2000 or 2008. If you had been more diversified but fully invested in the technology sector or leveraged real estate (both of which had been performing extremely well before the bubbles burst), you would have done better, but still faced enormous losses. Had you been invested in a broad market index, you would have still felt temporary pain, but you would have benefited from the generous long-run returns that the stock market has historically generated.
It’s tempting, as an investor, to try to guess what the future holds so you can somehow get ahead of it. Whether or not AI turns out to be a bubble is unknowable, and it’s out of your control. That’s why we think it’s smart to focus on the three things you can control: minimizing fees, minimizing taxes, and managing your risk through diversification. If you do these things, we think you’ll be well positioned to weather a variety of market conditions.
Disclosure
Investment management and advisory services are provided by Wealthfront Advisers LLC (“Wealthfront Advisers”), an SEC-registered investment adviser, and brokerage related products are provided by Wealthfront Brokerage LLC (“Wealthfront Brokerage”), a Member of FINRA/SIPC. Financial planning tools are provided by Wealthfront Software LLC (“Wealthfront Software”).
The information contained in this communication is provided for general informational purposes only, and should not be construed as investment or tax advice. Nothing in this communication should be construed as a solicitation, offer, or recommendation, to buy or sell any security. Any links provided to other server sites are offered as a matter of convenience and are not intended to imply that Wealthfront Advisers or its affiliates endorses, sponsors, promotes and/or is affiliated with the owners of or participants in those sites, or endorses any information contained on those sites, unless expressly stated otherwise.
Diversification and automated investing do not guarantee profit or ensure against loss. Investor experiences can vary widely based on strategies and time horizons. Index funds and ETFs generally offer broad diversification, but may still expose investors to specific market, sector, or asset class risks. Wealthfront provides investment management services but may not achieve returns comparable to those of the general market or specific benchmarks.
Wealthfront Advisers, Wealthfront Brokerage, and Wealthfront Software are wholly-owned subsidiaries of Wealthfront Corporation.
© 2026 Wealthfront Corporation. All rights reserved.
About the author(s)
Alex Michalka, Ph.D, has led Wealthfront’s investment research team since 2019. Prior to Wealthfront, Alex held quantitative research positions at AQR Capital Management and The Climate Corporation. Alex holds a B.A. in Applied Mathematics from the University of California, Berkeley, and a Ph.D. in Operations Research from Columbia University. View all posts by Alex Michalka, Ph.D
Dr. Burton G. Malkiel, the Chemical Bank Chairman’s Professor of Economics, Emeritus, and Senior Economist at Princeton University, is Wealthfront's Chief Investment Officer. Dr. Malkiel is the author of the widely read investment book, A Random Walk Down Wall Street, which helped launch the low-cost investing revolution by encouraging institutional and individual investors to use index funds. Dr. Malkiel, also the author of The Elements of Investing, is one of the country’s leading investor advocates. View all posts by