The end of one calendar year and the start of the next is when many Wall Street gurus present their “playbooks” for the year ahead. The predictions in these playbooks are frequently incorrect, and might encourage you to concentrate your portfolio in specific sectors or even specific stocks that performed well over the previous year. In a previous article, we wrote about the dangers of trying to pick the winning sector. In this post, we’ll explain why you probably shouldn’t just invest in last year’s winning stocks.
This advice to buy last year’s winners might sound wise—after all, if a stock has previously performed well, shouldn’t it continue to do so? Not necessarily. Actively switching your portfolio to favor certain stocks is not only tax-inefficient, but it is also likely to result in adding risk and lowering your investment returns.
But you don’t have to take our word for it. In this post, we’ll share some historical data to show what would have happened if you had only invested in the previous year’s best-performing stocks each year, and repeated this strategy over time.
What happens if you only buy last year’s best-performing stocks?
Let’s imagine that each year on January 1, you purchased the previous year’s best-performing US stocks (we’ll call this the “winners” portfolio) and then held them for the full year, only to sell your portfolio and repeat this process on the following January 1. For simplicity, we’ll ignore the impact of taxes and any fees or other transaction costs. We analyzed what would have happened if you followed this strategy from 1964 through the end of 2023—the longest period for which we have stock-level data. For robustness, we’ll test a variety of “winners” strategies by varying two inputs:
- The number of stocks chosen for the portfolio: 5, 10, 15, and 20
- The size of companies eligible for inclusion. We express this as a fraction of the total US market capitalization, and again use four different values: 85% (chosen to include most large-cap stocks), as well as 90%, 95%, and 98% (which we chose to include medium- and small-cap stocks).
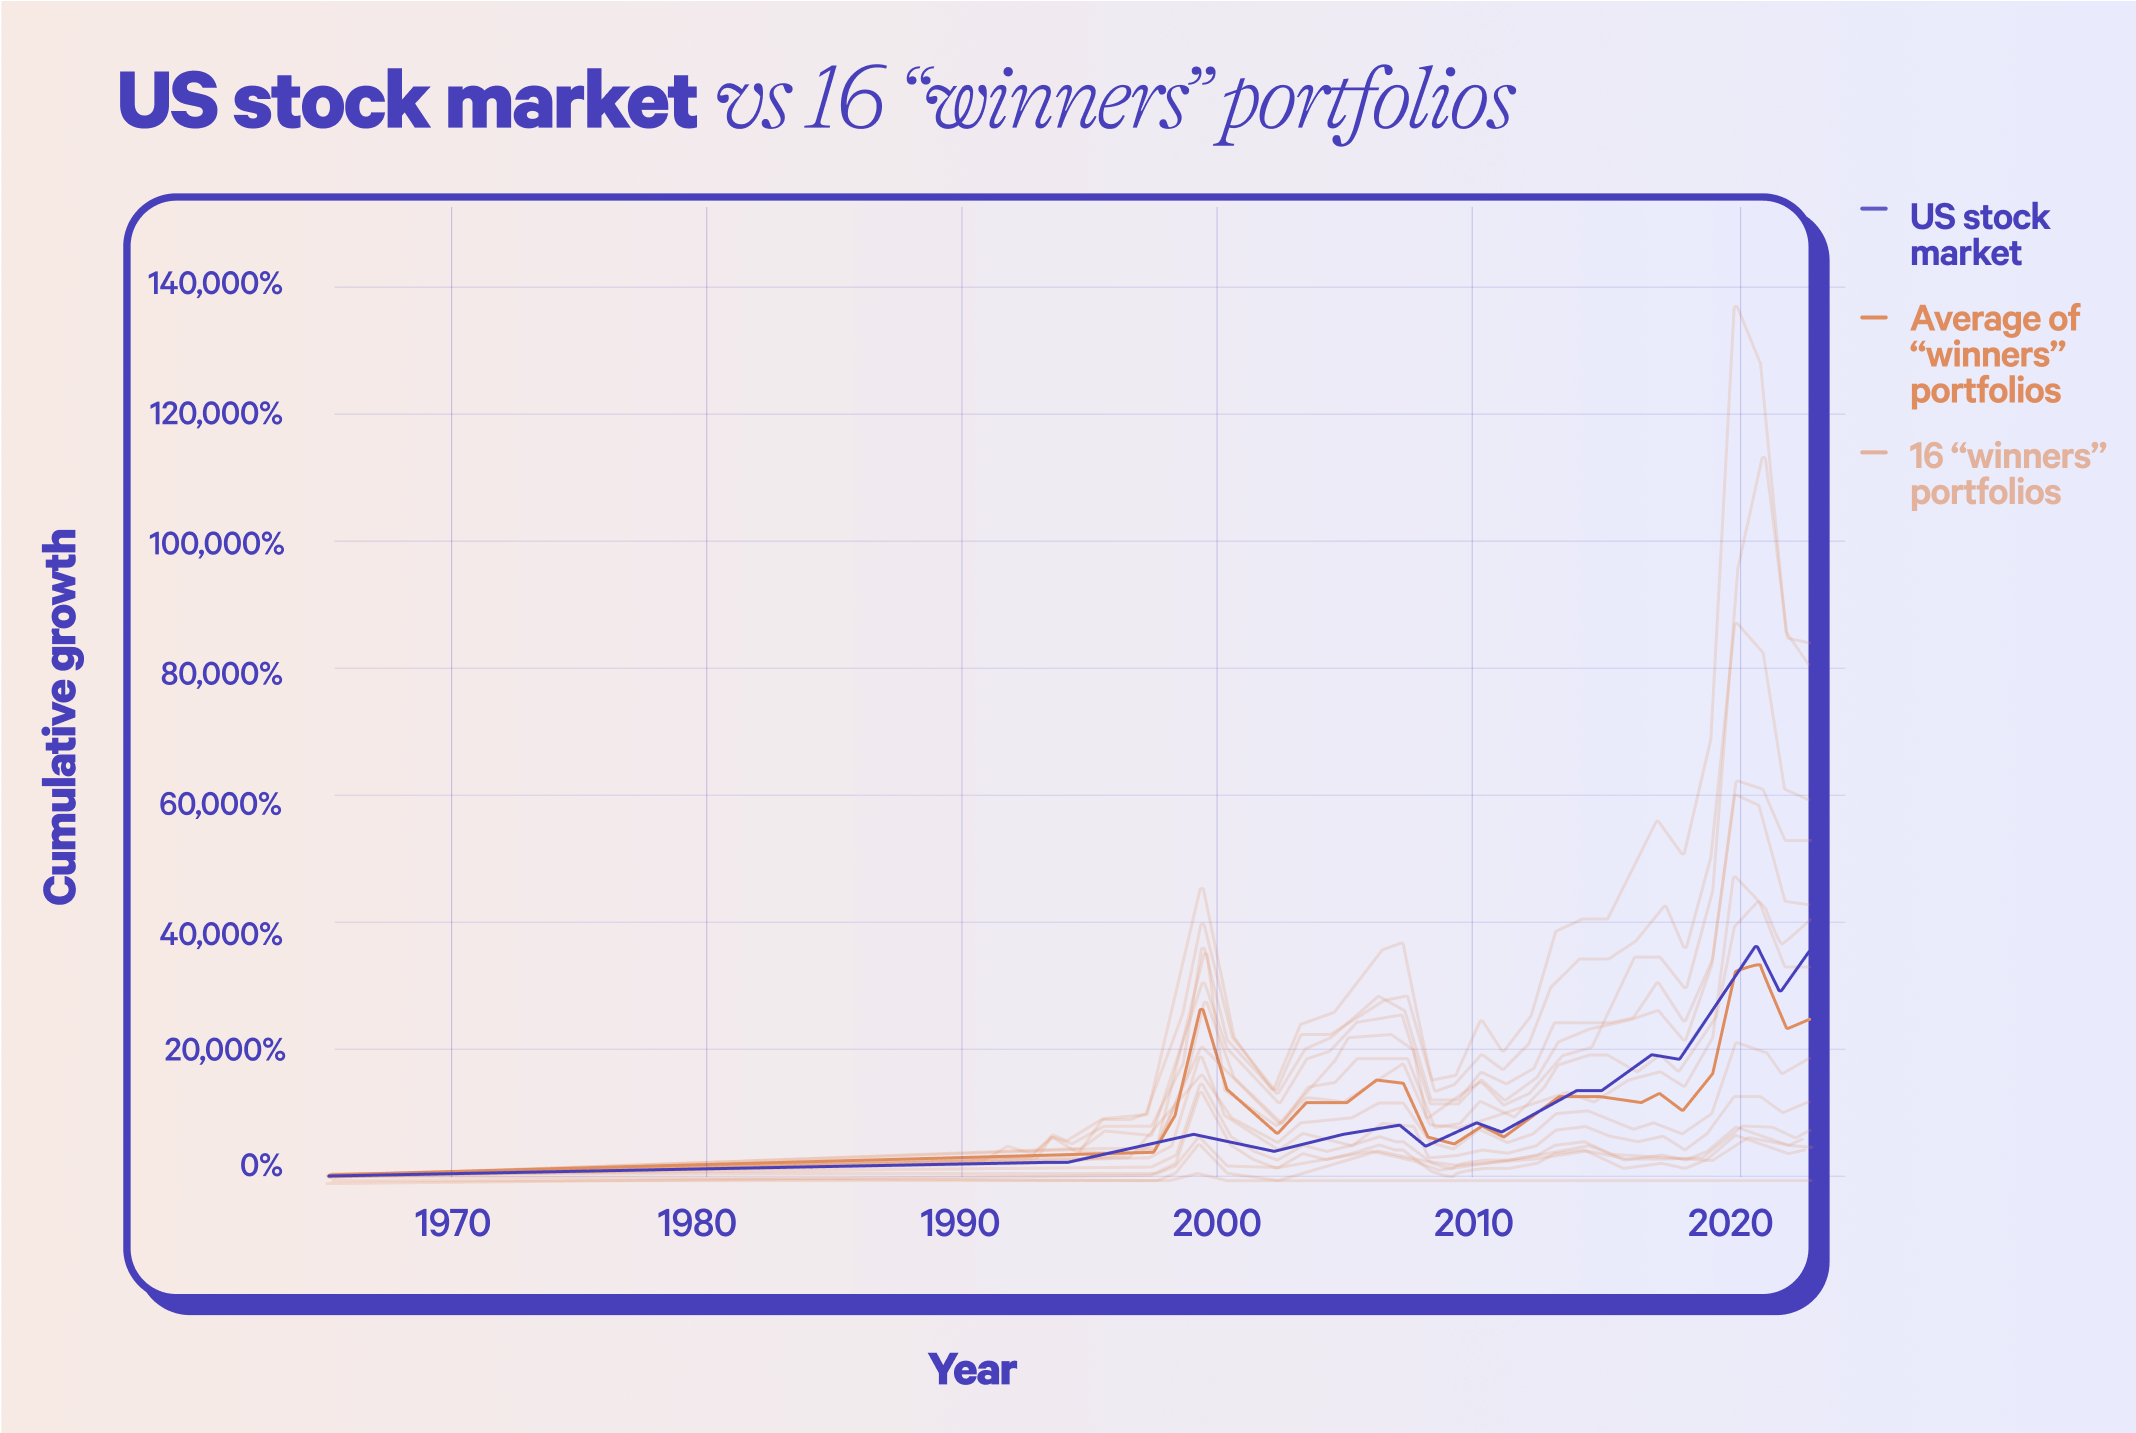
The chart below shows the cumulative return of the average of all 16 “winner” portfolios, along with the cumulative return of the US stock market. On average, the “winners” portfolios we studied performed worse, for the most part, than the total US stock market over the analysis period. This is true even though we excluded companies that would have gone bankrupt or stopped trading during the current year from the “winners” portfolios (we did this to avoid situations where we did not have a full year of data).
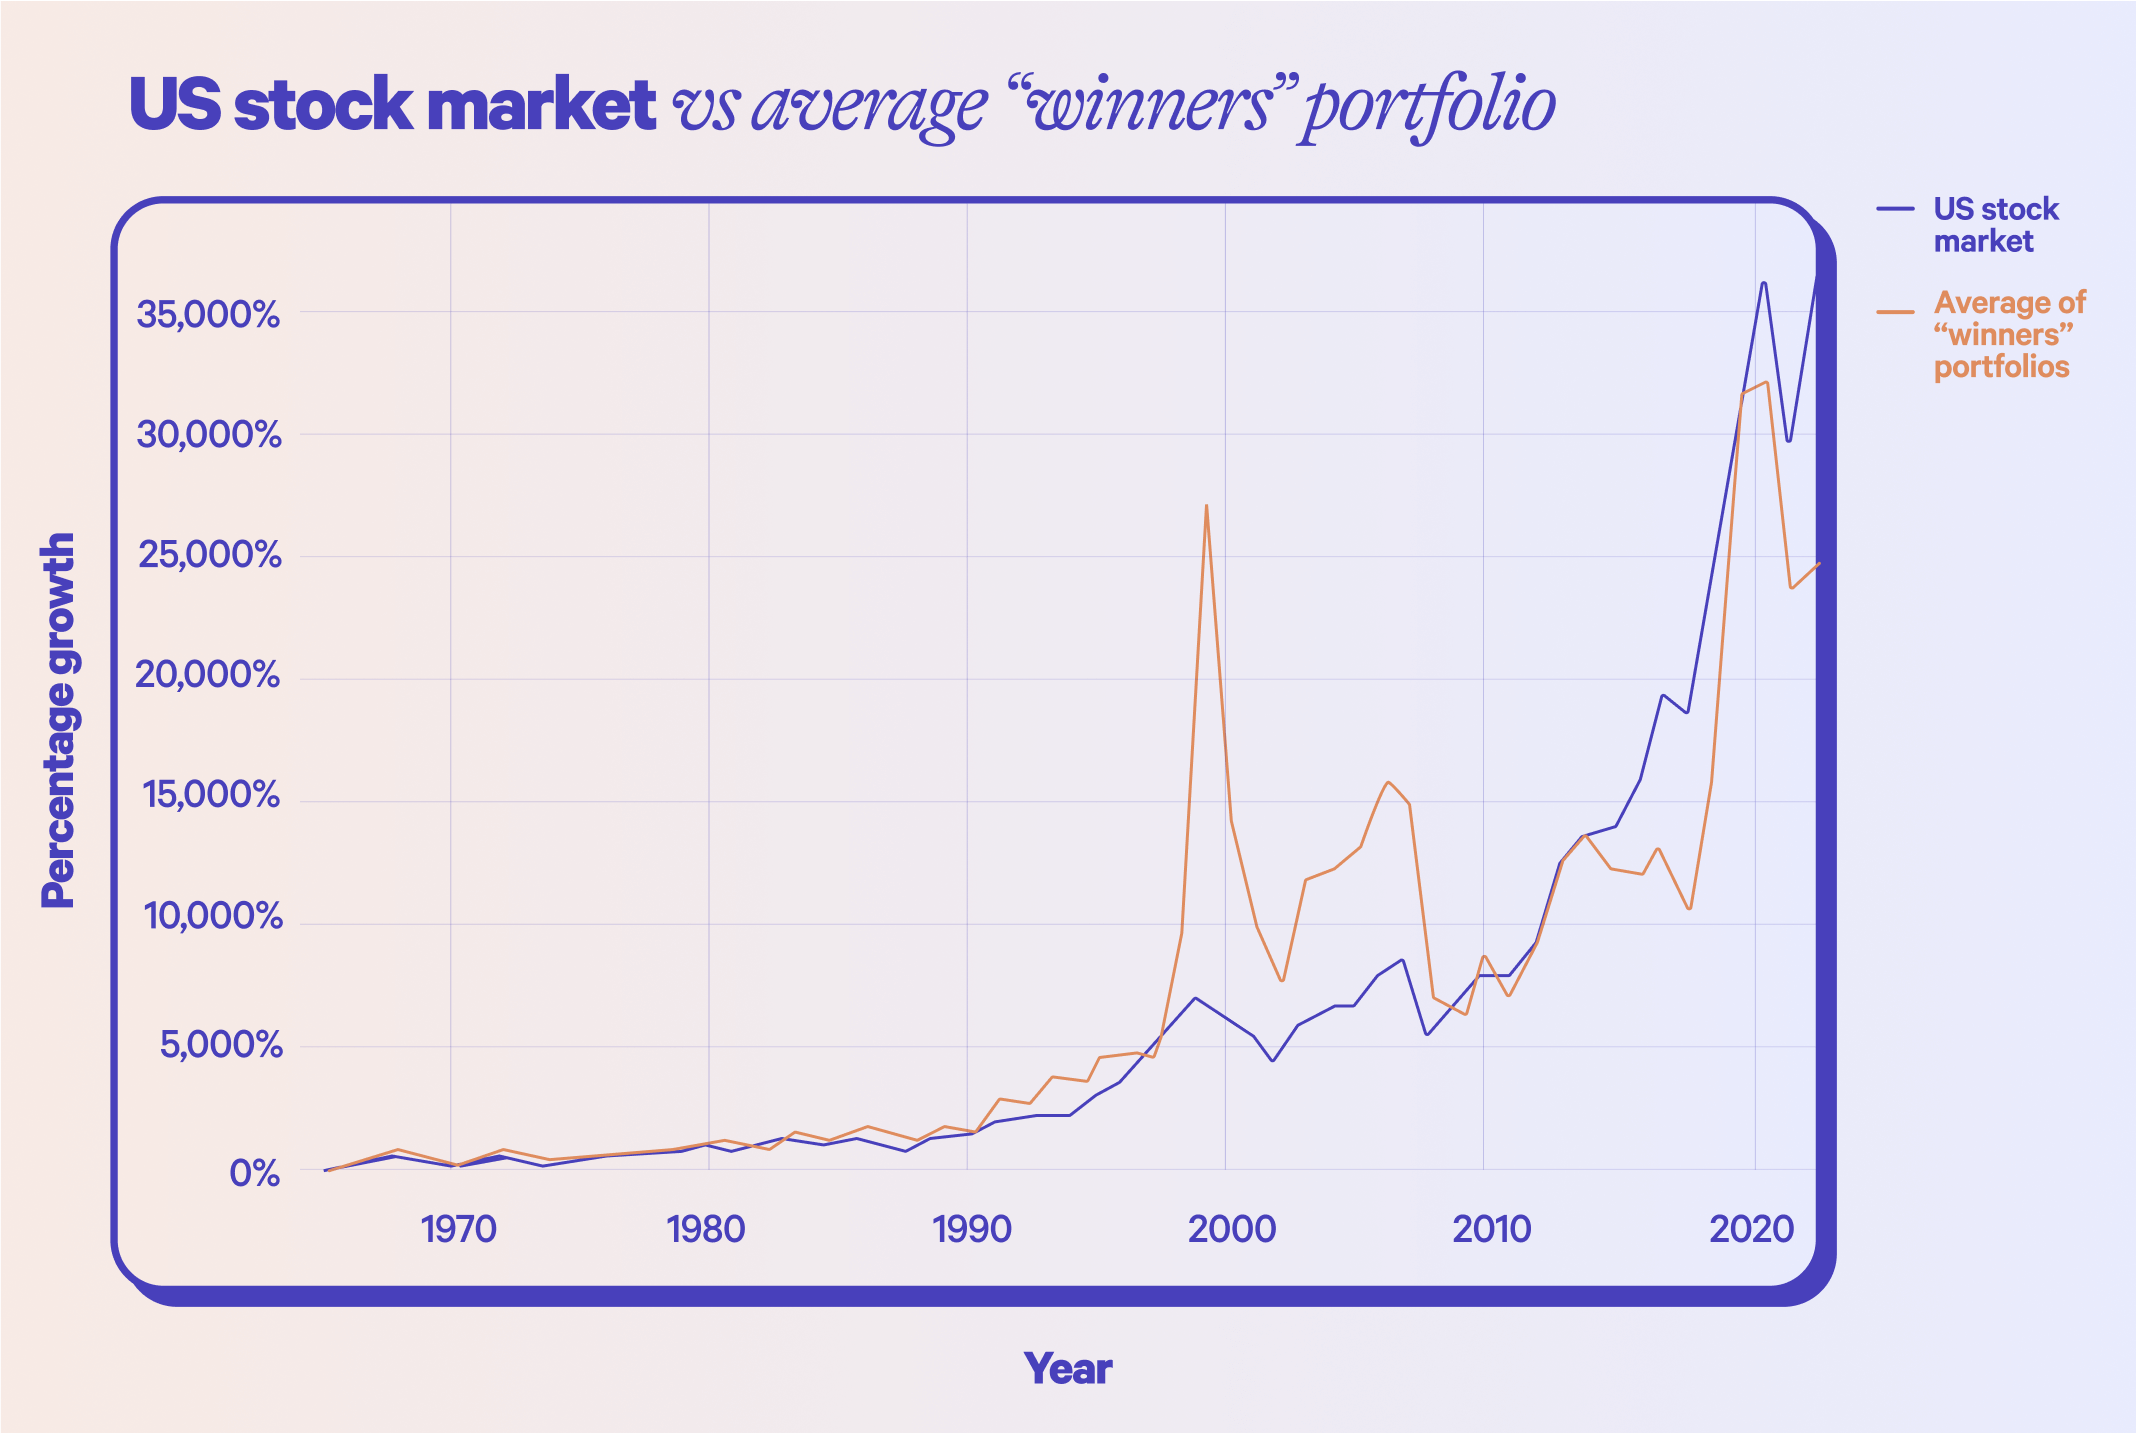
It’s worth noting that during the internet bubble of the late 1990s, the average “winners” portfolio did beat the US stock market handily. This is largely because tech stocks that performed well in 1998 (including Amazon, AOL, Yahoo, Dell, Best Buy, and Apple) also performed well in 1999. The average “winners” portfolio beat the US stock market for much of the 2000s, too. But over the whole period included in our analysis, the average “winners” portfolio return was 9.64%—0.73% lower than the 10.37% US stock market return.
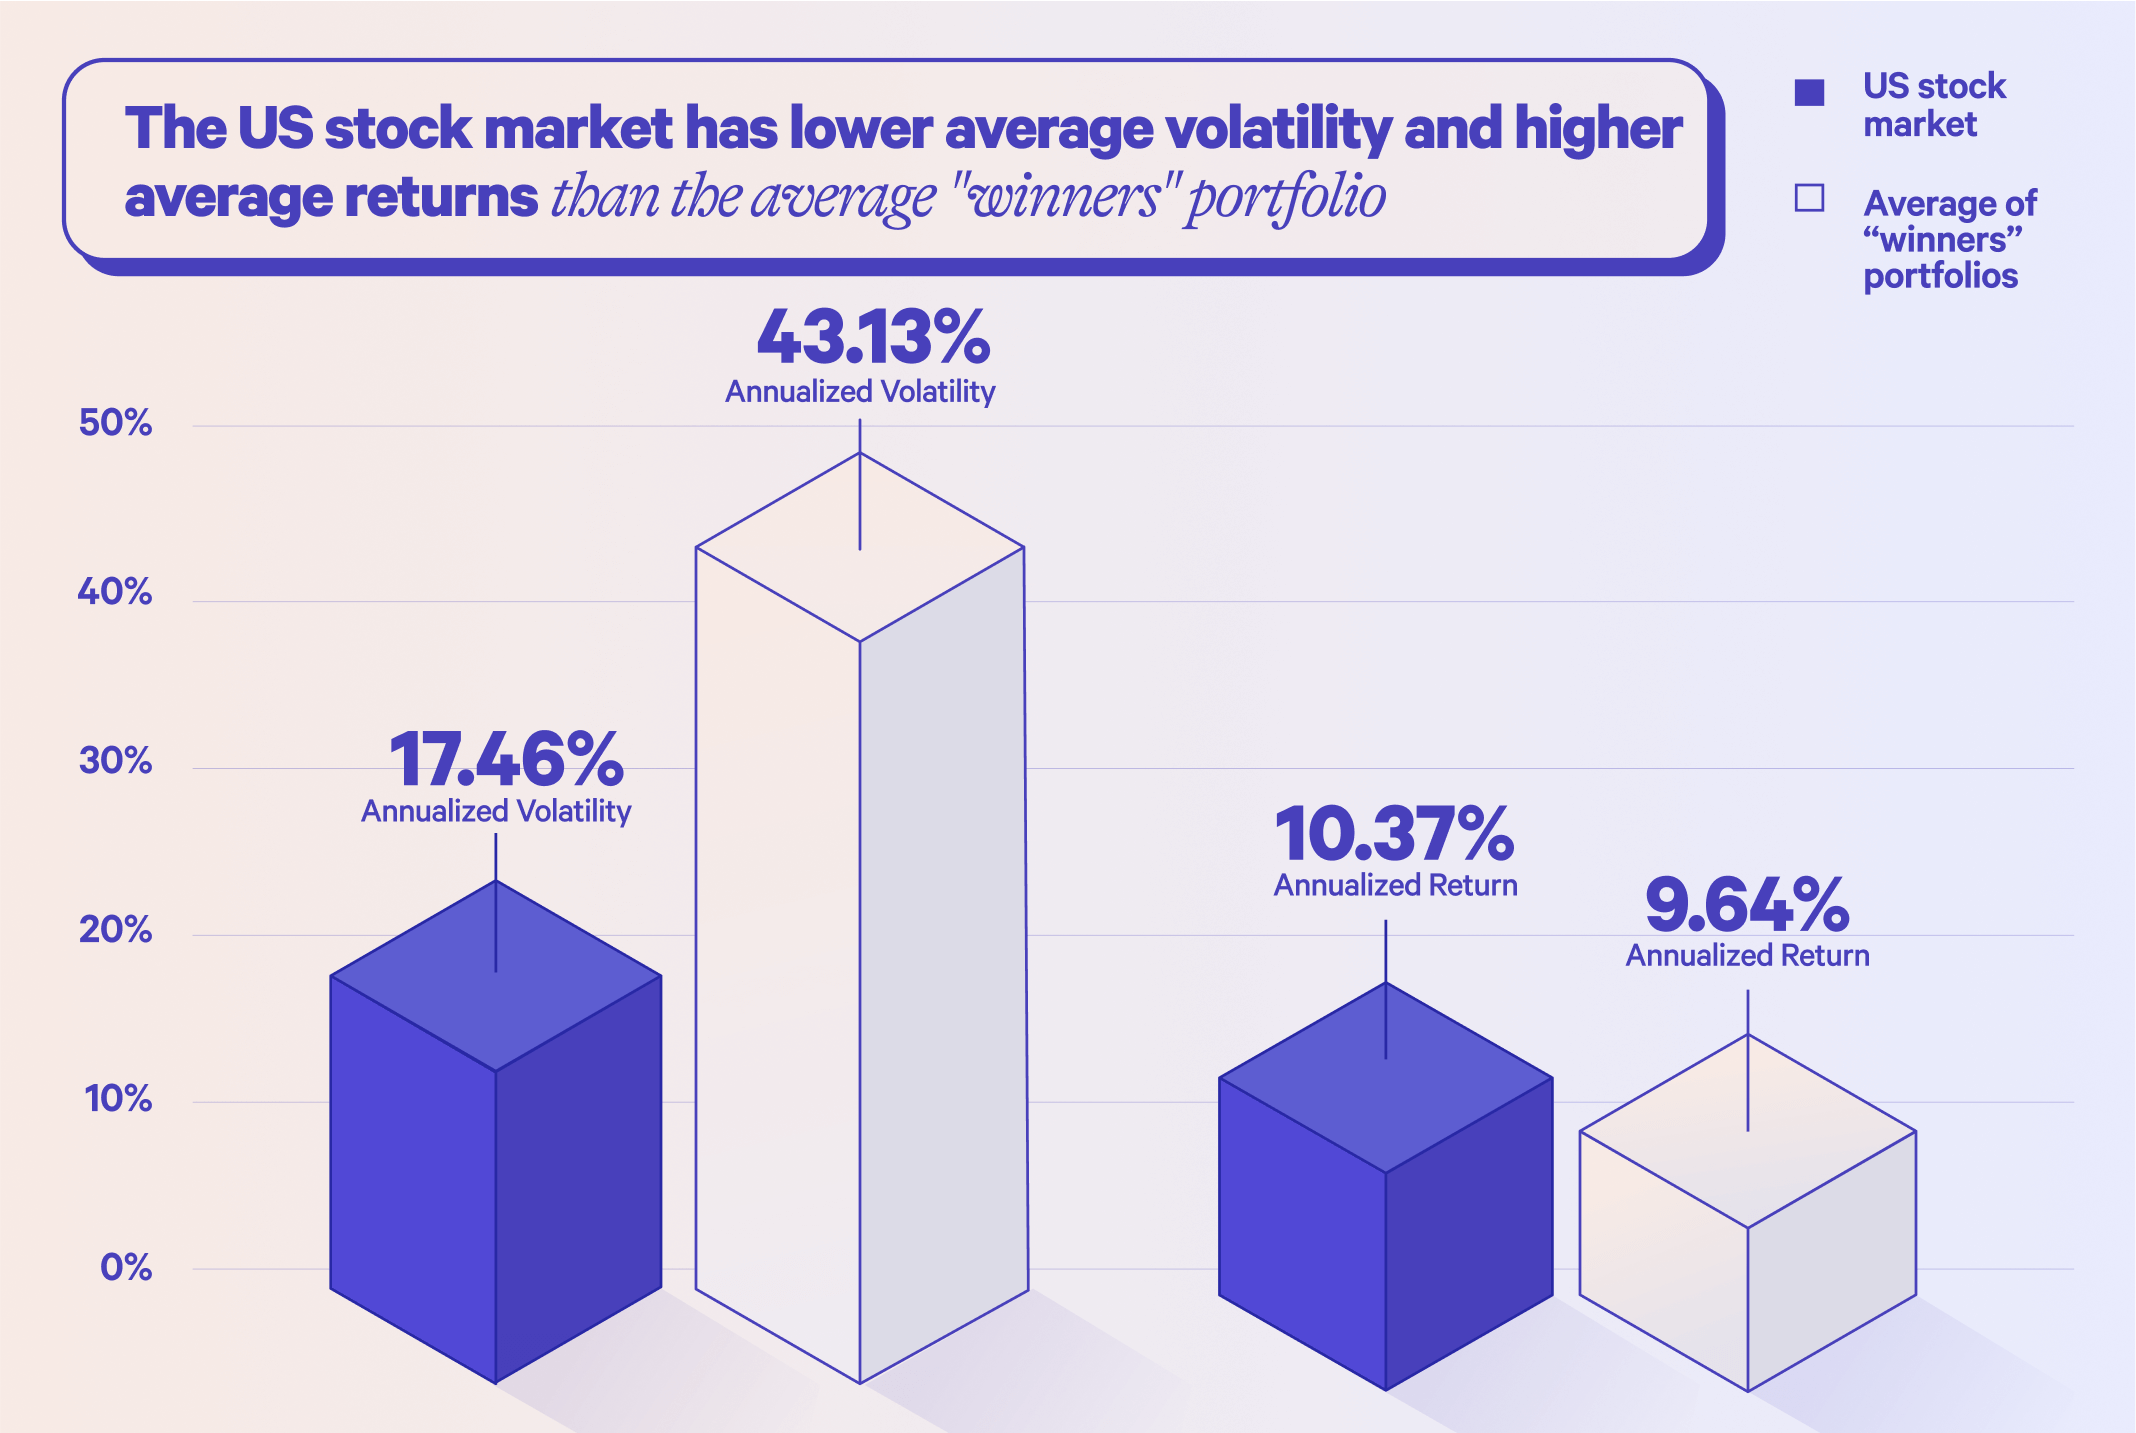
The average “winners” strategy was also far more volatile than the US stock market. Annualized volatility for the “winners” average portfolio was 43.13% compared to just 17.46% for the US stock market. Higher volatility matters because it can be difficult for investors to stomach, and ultimately it can cause them to sell at inopportune times which can lower returns. Consider that the worst calendar year for the “winners” average portfolio was a staggering -55.70% return, whereas the worst calendar year return for the US stock market over the analysis period was just -36.74%.
A closer look at the 16 “winners” portfolios
Let’s take a closer look at the “winners” portfolios. Our first observation is the wide range of results from the “winners” strategies. While the average return across all 16 was 9.64%, there was enormous variation around this average, ranging from -1.57% for five stocks and 98% of US market cap to 11.86% for five stocks and 85% of US market cap.
We counted the number of years during which the “winners” portfolio had a better return than the US stock market overall, and found that this was the case under half of the time (46.15%). That means that, if you pursued the “winners” portfolio, you would spend time and effort implementing a strategy that, on average, had worse than coin-flip odds of outperforming a passive investment in the entire US stock market. And this is before you take into account the potential tax consequences of the “winners” approach (remember: gains on investments you hold for a year or less are generally taxed at higher, ordinary income rates whereas investments you hold for longer are generally taxed at lower, long-term capital gains rates) and the fact that you’d have to be able to tolerate a higher level of volatility to actually realize the returns presented in this research.
It is true that sometimes, the “winners” approach had higher pre-tax returns than the US stock market. But do we think there’s something special about the “winners” portfolios that outperformed the US stock market, such that we would want to pursue those individual strategies going forward? No. The “winners” strategies all produce extremely volatile results; it’s not unexpected that several of the strategies achieved a better return over such a long period.
Some investors successfully implement a more sophisticated and labor-intensive version of the “winners” portfolio called momentum investing. Put simply, momentum investing involves buying stocks that are already performing well with the expectation that they will continue to do so. Research has confirmed that momentum investing can be a good strategy in some cases (in fact, momentum is one of five factors in Wealthfront’s Smart Beta), but unlike the “winners” strategy described in this post, it requires a lot of diligence in regularly monitoring the market and acting quickly, both to sell stocks that are underperforming and to buy those that are performing well over short time periods. An amateur investor isn’t likely to have the time, energy, and patience to execute it successfully.
And even though more sophisticated momentum strategies can beat the market on average over long periods of time, they may also underperform for long periods of time. Momentum makes the most sense as part of a multi-factor strategy that uses other factors that are relatively uncorrelated—you can think of this as a form of diversification, but with factors rather than assets.
What should you do instead?
Instead of wasting time and energy trying to outperform the market, we suggest that you keep it simple. The evidence is clear and consistent over time: Passively investing in index funds is a wise and time-tested strategy. According to a Wall Street Journal analysis of Morningstar research from the first half of 2024, more than 80% of actively managed ETFs and mutual funds that benchmark against the S&P 500® performed worse than the index. Similarly, according to a SPIVA report, in the first half of 2024, broad-based, low-cost index funds provided larger returns than nearly two-thirds of actively managed large- and mid-cap equities portfolios that attempted to pick the best stocks or best types of stocks. And the one-third of active managers who outperform the market in one year are not likely to do so in the subsequent year.
You should also keep in mind that a well diversified portfolio like Wealthfront’s Classic portfolio will, in most cases, still give you exposure to last year’s winning stocks through index-based ETFs. So will Wealthfront’s S&P 500 Direct, which offers similar performance to an S&P 500® ETF. (As a bonus, both accounts can also generate valuable tax savings through our automated Tax-Loss Harvesting.) We don’t think you should avoid having last year’s winning stocks in your portfolio—we just don’t think they should constitute your entire portfolio.
Disclosure
The information contained in this communication is provided for general informational purposes only. Nothing in this communication should be construed as investment or tax advice, a solicitation or offer, or recommendation, of any security or investment strategy. Any links provided to other server sites are offered as a matter of convenience and are not intended to imply that Wealthfront Corporation (“Wealthfront”) or any of its affiliates endorses, sponsors, promotes, and/or is affiliated with the owners of or participants in those sites, or endorses any information contained on those sites, unless expressly stated otherwise.
Investment management and advisory services are provided by Wealthfront Advisers LLC (“Wealthfront Advisers”), an SEC-registered investment adviser, and brokerage related products are provided by Wealthfront Brokerage LLC (“Wealthfront Brokerage”), a Member of FINRA/SIPC. All investing involves risk, including the possible loss of money you invest, and past performance does not guarantee future performance. Please see our Full Disclosure for important details.
The analysis, performance, and comparisons described is hypothetical and for illustrative purposes only. It is not based on actual investment results or an actual portfolio that is managed. Results shown exclude the impact of taxes, transaction costs, management fees, and other expenses that would have reduced returns. The “winners” portfolios are based on a retrospective selection of stocks, based on annual return in the previous calendar year, and do not reflect actual investment decisions made. This analysis does not guarantee or predict the future performance of any investment strategy.
The volatility and returns presented are calculated based on historical data and do not account for factors such as liquidity constraints or investor behavior. Higher volatility, as discussed, could lead to behavioral challenges for investors and may not fully represent the practical experience of implementing such a strategy.
Services and products, including the Classic portfolio and S&P 500 Direct, utilize diversified index-based investment strategies and offer features such as Tax-Loss Harvesting, which may provide tax benefits. The actual impact of these features depends on your individual circumstances, and there is no guarantee of improved investment outcomes. Before making any investment decisions, clients should carefully consider their financial situation and goals and should consult with a qualified financial and/or tax professional.
The effectiveness of the Tax-Loss Harvesting strategy to potentially reduce the tax liability of the client will depend on the client’s entire tax and investment profile, including purchases and dispositions in a client’s (or client’s spouse’s) accounts outside of Wealthfront Advisers and type of investments (e.g., taxable or nontaxable) or holding period (e.g., short- term or long-term).
The S&P 500® (the “Index”) is a product of S&P Dow Jones Indices LLC and/or its affiliates (“S&P DJI”) and/or their third-party licensors and has been licensed for use by Wealthfront. S&P®, S&P 500®, US 500™, The 500™, are trademarks of S&P Global, Inc. or its affiliates (“S&P”); Dow Jones® is a registered trademark of Dow Jones Trademark Holdings LLC (“Dow Jones”); third party licensor trademarks in the Index, if any, are trademarks of the respective third party licensors. The S&P 500 Index and S&P 500® have been licensed for use by S&P DJI and sublicensed for certain purposes by Wealthfront. Wealthfront’s statements are not endorsed by and Wealthfront’s products are not sponsored, endorsed, sold or promoted by S&P DJI, Dow Jones, S&P, their respective affiliates, or their third-party licensors and none of such parties make any representation regarding the advisability of investing in such product(s) nor do they have any liability for any errors, omissions, or interruptions of the Index.
Wealthfront Advisers and Wealthfront Brokerage are wholly owned subsidiaries of Wealthfront.
© 2025 Wealthfront Corporation. All rights reserved
About the author(s)
Dr. Burton G. Malkiel, the Chemical Bank Chairman’s Professor of Economics, Emeritus, and Senior Economist at Princeton University, is Wealthfront's Chief Investment Officer. Dr. Malkiel is the author of the widely read investment book, A Random Walk Down Wall Street, which helped launch the low-cost investing revolution by encouraging institutional and individual investors to use index funds. Dr. Malkiel, also the author of The Elements of Investing, is one of the country’s leading investor advocates. View all posts by
Alex Michalka, Ph.D, has led Wealthfront’s investment research team since 2019. Prior to Wealthfront, Alex held quantitative research positions at AQR Capital Management and The Climate Corporation. Alex holds a B.A. in Applied Mathematics from the University of California, Berkeley, and a Ph.D. in Operations Research from Columbia University. View all posts by Alex Michalka, Ph.D