
Have you ever thought that you’re too young or too busy to think about retirement? If that sounds familiar, you’re not alone. When it comes to planning for retirement the biggest obstacles to starting are often self-created. Life gets in the way, so it’s easy to put off retirement in place of other things that seem more pressing. In fact, only 39% of Americans have tried to figure out how much they need to save for retirement according to a study by the Financial Industry Regulatory Authority (FINRA).
Those who actually do take action sooner typically seek the services of a traditional financial planner. For many working directly with a financial advisor is the right solution, as the top planning professionals can make the right assumptions and provide a holistic view of your financial health. However, the process of finding a highly qualified person is often harder than it seems. Moreover, they typically come with high investment minimums, not to mention high fees (on average, 1% per year).
A do-it-yourself approach is definitely an alternative, but it requires a knowledge and understanding of finance. Not to mention, it takes a lot of time. But the most challenging part of doing it yourself is deciding on all the assumptions that are key to understanding your prospects in retirement, like returns, retirement spending needs, social security, inflation, taxes and many other variables. Some might have the time and financial acumen to work all of that out, but the reality is most people don’t.
Making assumptions about retirement requires a lot of heavy lifting, so you want to make sure you or your planner are focused on the right things. At Wealthfront we built Path, our financial planning advice engine, to ensure that your retirement plan is, indeed, based on the right things for you. With Path the assumptions we consider are based on academic research and best practices, designed by our research team to help take that burden off of our clients. But while the combination of our PhDs and software make retirement planning easy, it’s always a good idea to understand what those important assumptions are and how to consider them when it comes to your retirement. Today we’ll walk you through the assumptions we consider and why they are are important.
Retirement Spending
If you intend to keep your current lifestyle in retirement it’s important to know how much you are spending today, as well as how your spending is likely to change in retirement. To do that we aggregate data from your linked accounts and use that information to estimate how much you spend now. We also rely on an extensive set of machine learning models to classify your transactions before producing the estimates of monthly spending our clients see on their plans. After we have an estimate of your current spending, we use data from the Consumer Expenditure Survey (used by academics for research on spending behavior) to estimate how much spending changes as people get older and retire. This allows you to have an accurate figure of what a person like yourself on average would need in retirement. It also saves you a ton of time.
In the figure below we plot our estimates of how spending of working adults changes over life, starting at age 25 (normalized to 100 at this age). We observe that spending increases about 90% between age 25 and age 50, but then it flattens out (the numbers are adjusted for inflation, so the purchasing power in this flatter region is about constant). These estimates use a sample of working adults with a college degree, and they control for several demographic characteristics of the household such as the size of the family and the number and age of children, all of which can affect spending considerably.
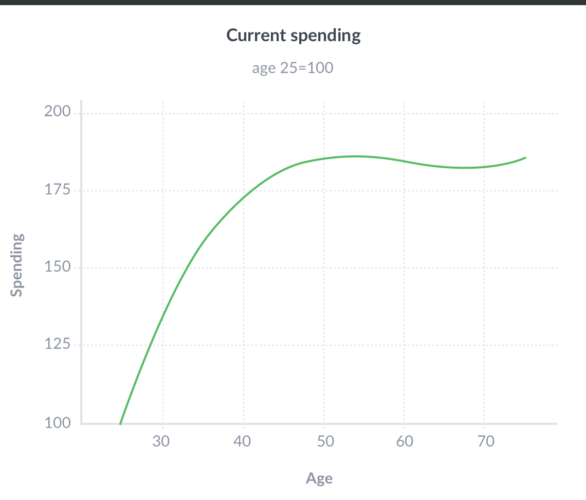 Figure: Growth in spending since age 25 for working adults with a college degree
Furthermore, we estimate a 13% drop in spending at the time of retirement. That might seem counterintuitive, especially since things like health care costs increase considerably in retirement. But as research by professors Erik Hurst from the University of Chicago and Mark Aguiar from Princeton University shows, there is strong evidence that certain expenses diminish, such as the costs related to working (commuting, business attire, lunch meals, etc.).
By leveraging that study we take into account both the increase in spending until just before you retire, as well as the drop in spending as you settle into retirement. For example, we estimate that a 25 year old will spend around 75% more in retirement than their current spending level, but that 55 year old will spend around 13% less than what they are currently spending in retirement. This approach is much more personalized than using a fixed income replacement ratio (like most financial planners do), and it also takes into account that expenses will change over your life.
Taxes
After you get an estimate of how much money you’ll need in retirement, you’ll then need to build a savings plan to achieve that goal. However, it’s important to understand the tax implications. For example, the money saved in a traditional IRA account will be taxed differently from a Roth IRA account or a traditional brokerage account. So to get a true estimate how your savings will enable your retirement lifestyle, it’s imperative to estimate your tax bill.
Doing your taxes is never easy, and unfortunately with retirement it gets even more complex because of the different tax treatments across different retirement accounts. In the table below we show two different scenarios. In the first one, the retiree has balances in both a Traditional IRA and a Roth IRA, and makes equal withdrawals from both. In the second example, the retiree only has and withdraws from a Roth account. Assuming a tax rate of 30% (and ignoring deductions for simplicity), the tax bill in the first scenario is $1,500 while in the second scenario there is no tax bill. Taxes are 15% of total income in one case, but 0% in the other — the difference is huge!
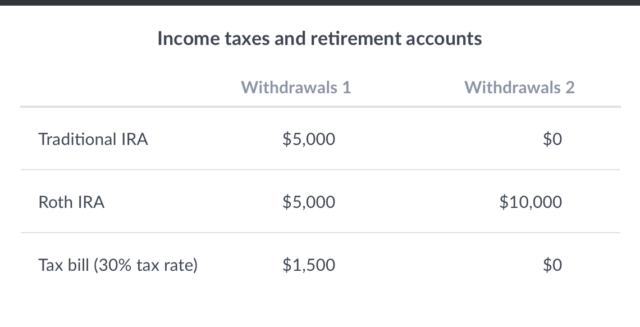
Table: Income taxes and retirement accounts
Making the wrong assumption about taxes can have a huge impact on accurately assessing what you’ll actually have to spend in retirement. The good news is that Path automatically detects your account types and project your other sources of income (such as Social Security) to make an estimate of your tax bill that includes federal and state income taxes. We even take possible deductions into account to ensure the most accurate forecast.
Social Security
Even if you are only in your 30s or 40s it’s important to get an accurate view of your likely Social Security income and how it will affect your spending in retirement. We’ve previously written in detail about the surprising value of claiming Social Security at the correct time, but in short postponing Social Security a few years can have higher returns than most investments, even after adjusting for risk. Those returns will be higher if you have a higher life expectancy, since you’ll be able to collect benefits for a longer period of time. So in deciding the optimal age to claim your Social Security benefits it’s important weight the trade-off in delaying because of the shorter period of time you’ll receive that benefit. We make it easy by selecting the best age for you to claim social security so you can make the right call about what you need to save.
Inflation
The “sleeper” assumption that many forget to consider is inflation, which is critical in understanding how much you’ll really be worth at retirement. It’s extremely important to take into account the effects of inflation, since it reduces the purchasing power of the money you are working so hard to save. For example, if you’re 35 and want to maintain your $8000 monthly lifestyle you enjoy today when retired you’ll need $14,500, assuming a 2% inflation rate and a retirement age of 65. We use market-based inflation expectations, which means comparing the yields on long-term treasury bonds and on long-term inflation-protected treasury securities (see this post) as our assumption for future inflation. That way our inflation assumption is automatically updated as markets change.
Returns
A central piece of the retirement planning puzzle is understanding how your current and future savings are likely to evolve over time. But because different people might have very different portfolios there isn’t a good one-size-fits-all assumption you can make about future market returns. In other words, you need to make assumptions regarding the returns of your portfolio. At Wealthfront, we obtain those assumptions using our Capital Markets Model.
This model uses a factor-based framework drawing on the work of several Nobel prize winning financial economists. This research has shown that although there are many individual assets and asset classes, their returns are driven by a few common sources of risk (i.e. factors). For example, individual stock returns tend to be positively correlated with returns on broad stock market indices, such as the CRSP U.S. Total Market Index. Similarly, returns on individual bonds are correlated with returns on U.S. Treasury bonds. More generally, each security can be characterized based on its exposure to the broad U.S. equity market and U.S. Treasuries, effectively measuring how “stock-like” or “bond-like” a security is. However, it is important to recognize that some of the volatility of an individual security will be entirely unrelated to stock and bond markets, which is known as the idiosyncratic volatility of the security.
Let’s work out one example using a stock market factor and a bond market factor1. The exposure of a security or portfolio to a factor is usually called the “loading” of the security on that factor. For example, if a security has a loading of one (1) on stocks and a loading of zero (0) on bonds, then it is a stock-like security. In the table below we display the statistics for two different Exchange Traded Funds (ETFs): the Vanguard Emerging Markets Government Bond ETF (VWOB) and the Vanguard Intermediate-Term Corporate Bond ETF (VCIT). Note that even though they are bond ETFs, both have a significant stock-like component. In fact, VWOB has about the same exposure on stocks and bonds market even though it’s a bond ETF.
Because of this exposure to the stock market, these securities will tend to have a much higher expected return than the bond market. In the table we calculate the expected return on each security assuming a stock market return of 7% and a bond market return of 3%2. Under these assumptions the expected return on those two bond ETFs is above 4%, which is much higher than the 3% return assumption on bonds. That’s because they are highly exposed to stock market risk.
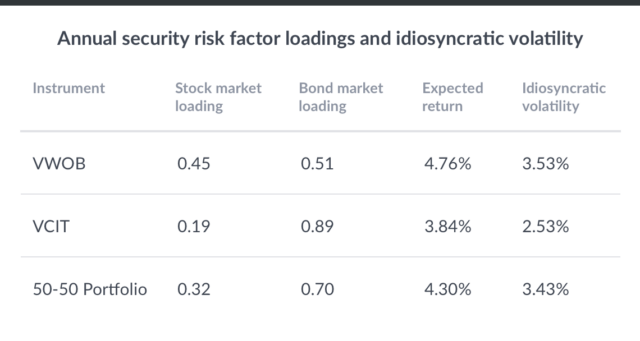
Table: Security risk factor loadings and idiosyncratic volatility (annual)
You likely have a portfolio of multiple securities, so what really matters is the portfolio return assumption. At Wealthfront we compute expected returns in a portfolio of securities based on our estimates for the exposures of each security to different market risks. In the table we show the statistics for a 50/50 portfolio of the two bond ETFs. The expected return in this case is the average of the expected returns of the two securities, in this case 4.30%. Again, this is very different from the return assumption we have on a broad bond market index, even though the portfolio has only bonds. The 1.30% difference in returns compounds to 47% in returns over 30 years, which is a common horizon in retirement planning.
But you might be interested in a more conservative estimate of returns, such as a return that would happen at least 50% of the time (the median return). To achieve that it’s also important to estimate not only the exposure of the security to stock and bond markets, but also the risk specific to your portfolio that is uncorrelated with bond or stock markets (i.e. the idiosyncratic risk). So to compute the median return you need to simulate thousands of scenarios for returns on market risk factors and the idiosyncratic risk on each portfolio (known as Monte Carlo simulations).
Chances are your actual portfolio has many more than two securities, so you’d need to obtain historical return data for all of those in order to estimate factor exposures and obtain an accurate expected return given your assumptions. That’s a daunting task, but Wealthfront does this for you. We use data on around 40,000 different securities to produce median return assumptions on our client’s portfolios to help them have a more accurate view (via Path) of their prospects in retirement.
The Verdict
The reality is just putting money away for retirement isn’t enough. You have to understand and consider the right assumptions when building your plan so it’s specific to your needs. A top financial planner will no doubt make the right assumptions for you and will provide you a complete view of your finances. However, for those who want high research value without the added expense and investment requirements of a traditional advisor, planning with Path is the better — and easier — alternative.
1We use the CRSP U.S. Total Market Index as the stock market factor and the return on 5-Year U.S. Constant Maturity Treasuries as the bond market factor. We obtain the loadings, or partial correlations, of each instrument on these two factors using statistical methods to estimate the partial correlations between instrument returns and factor returns.
2The expected return of a particular security in this model is the sum of the risk free rate plus the loading on each factor times the expected return on that factor over the risk free rate. We assume a risk free rate of 2% in the calculations.
Disclosure
Nothing in this blog should be construed as tax advice, a solicitation or offer, or recommendation, to buy or sell any security. Financial advisory services are only provided to investors who become Wealthfront Inc. clients pursuant to a written agreement, which investors are urged to read carefully, that is available at www.wealthfront.com. All securities involve risk and may result in some loss. Wealthfront Inc.’s financial planning services are designed to aid our clients in preparing for their financial futures and allows them to personalize their assumptions for their portfolios. Wealthfront Inc.’s free financial planning guidance is not based on or meant to replace a comprehensive evaluation of a Client’s entire financial plan considering all the Client’s circumstances. For more information please visit www.wealthfront.com or see our Full Disclosure. While the data Wealthfront uses from third parties is believed to be reliable, Wealthfront does not guarantee the accuracy of the information.
This article is not intended as tax advice, and Wealthfront does not represent in any manner that the outcomes described herein will result in any particular tax consequence. Prospective investors should confer with their personal tax advisors regarding the tax consequences based on their particular circumstances. Wealthfront assumes no responsibility for the tax consequences to any investor of any transaction. Investors and their personal tax advisors are responsible for how the transactions in an account are reported to the IRS or any other taxing authority.
Performance projections are hypothetical and not an indicator of any investor’s actual current or future experience and is provided for illustrative purposes only. Hypothetical performance is developed with the benefit of hindsight and has inherent limitations. Specifically, hypothetical results do not reflect actual trading or the effect of material economic and market factors on the decision-making process. Wealthfront assumed we would have been able to purchase the securities recommended by the model and the markets were sufficiently liquid to permit all trading. Investors evaluating this information should carefully consider the processes, data, and assumptions used by Wealthfront in creating its simulations. Projected results are adjusted to reflect the reinvestment of dividends and other income but do not reflect the deduction of any advisory fee.
About the author(s)
Pedro Olea de Souza e Silva is a Senior Quantitative Researcher at Wealthfront. His work mainly focuses on applying economic modeling and quantitative data analysis to Wealthfront’s financial planning experience. He earned a PhD in Economics from Princeton University where he studied behavioral economics. Prior to Princeton, he received an MS in Economics from the Getulio Vargas Foundation, and a BS in Economics from the University of Sao Paulo, both in Brazil. View all posts by Pedro Olea de Souza e Silva, PhD